
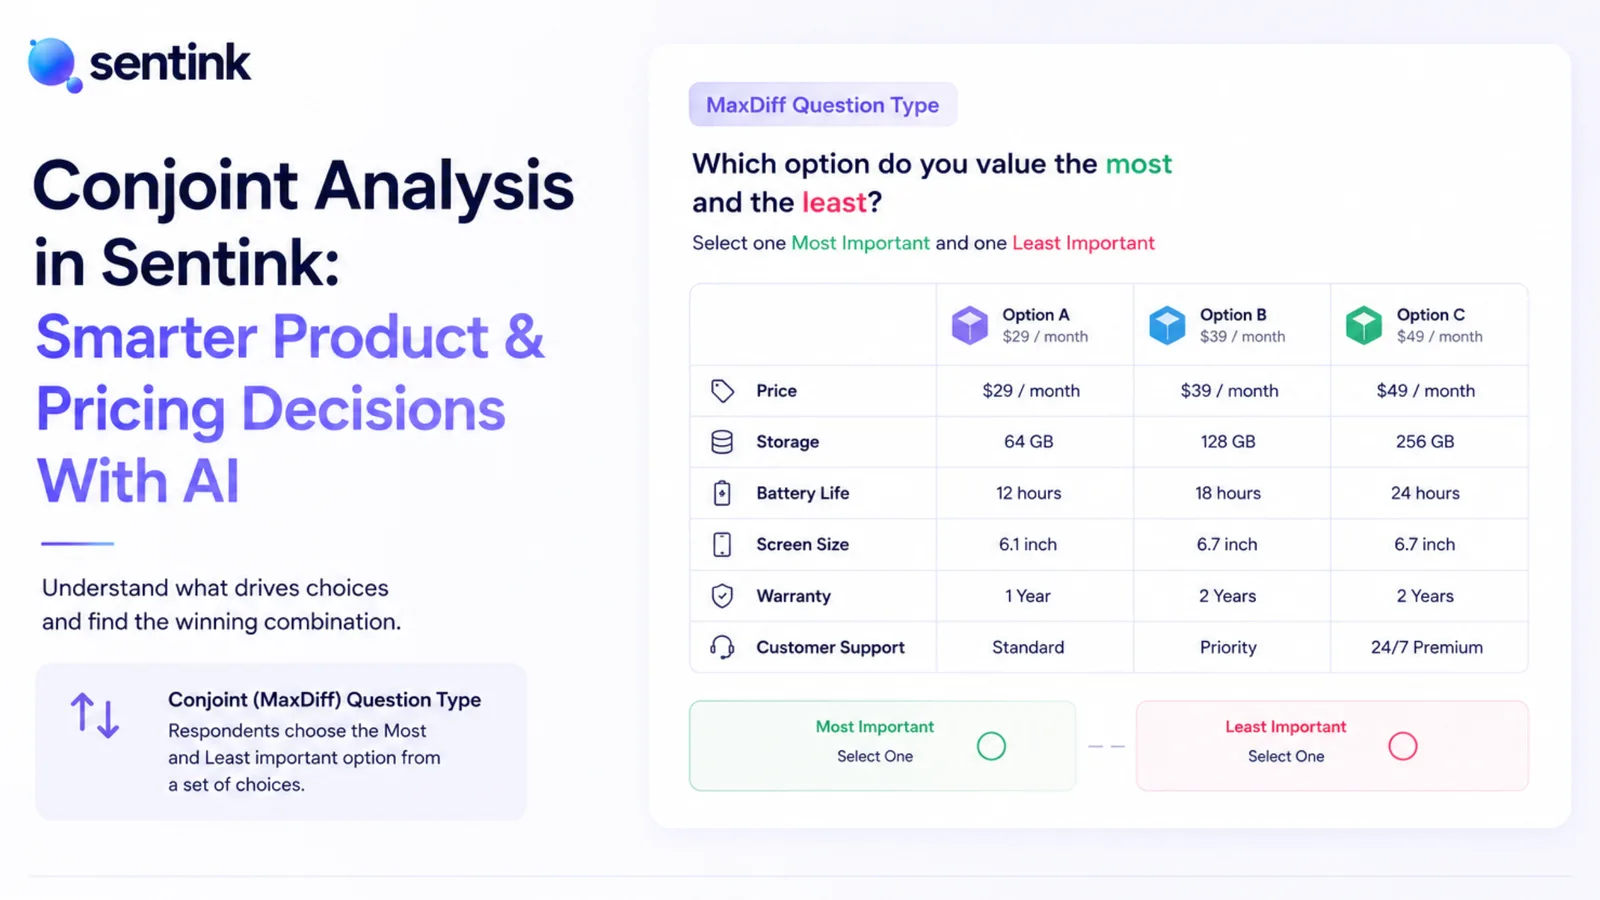
Conjoint Analysis in Sentink: Smarter Product & Pricing Decisions With AI
Modern customers make decisions through trade-offs.
They compare:
- Price
- Features
- Brand
- Delivery speed
- Warranty
- Experience
Traditional surveys often ask people directly:
“What matters most to you?”
But real buying behavior is rarely that simple.
This is where Conjoint Analysis becomes one of the most powerful methodologies in market research.
What Is Conjoint Analysis?
Conjoint Analysis is a research technique used to understand how people evaluate different combinations of product or service features.
Instead of rating features independently, respondents are shown realistic product combinations and asked to choose their preferred option.
This helps organizations understand:
- What truly drives customer decisions
- Which features increase preference
- How sensitive customers are to price
- Which product combinations perform best
Conjoint Analysis Inside Sentink
Sentink supports advanced Choice-Based Conjoint (CBC) analysis directly inside the platform.
Respondents are presented with multiple choice tasks.
Each task contains:
- Several concepts
- Multiple attributes
- Different attribute levels
Example:
| Attribute | Levels |
|---|---|
| Price | $9 / $19 / $29 |
| Delivery | Same Day / 2 Days / 5 Days |
| Brand | Brand A / Brand B |
| Warranty | 1 Year / 3 Years |
Respondents select:
- Their preferred option
- Or optionally: “None of these”
This creates realistic preference behavior instead of simple opinion collection.
How Sentink Processes Conjoint Data
Sentink reconstructs:
- Choice occasions
- Experimental design structures
- Weighted response sets
The platform then applies:
- Aggregate multinomial logit modeling
- Ridge regularization
- Preference share simulation
The result is a practical business-focused conjoint workflow integrated directly into the survey experience.
Real Business Use Cases
Product Pricing Optimization
Understand:
- Which price levels customers prefer
- Whether premium features justify higher pricing
- How price impacts preference share
Example
A SaaS company tests:
- $49/month
- $99/month
- $149/month
against:
- AI features
- Reporting capabilities
- Automation limits
to determine the optimal market position.
Product Feature Prioritization
Not every feature has equal value.
Conjoint analysis helps identify:
- Which features increase preference
- Which features customers ignore
- Which improvements deserve investment
Packaging & SKU Design
Brands can evaluate:
- Package sizes
- Product bundles
- Colors
- Variants
- Country of origin
- Retail formats
before launching products into the market.
Competitive Scenario Testing
Sentink’s simulator allows teams to compare:
- Their own products
- Competitor concepts
- Hypothetical future offers
This creates a powerful “what-if” strategy environment.
Customer Segment Analysis
Different audiences value different things.
Sentink allows conjoint outputs to be segmented by:
- Age
- Gender
- Country
- Subscription type
- Customer behavior
- Survey questions
This helps organizations identify:
- Price-sensitive audiences
- Brand-driven audiences
- Convenience-focused segments
Types of Analysis Available in Sentink
Relative Importance Analysis
Shows how strongly each attribute influences customer choice.
Example:
| Attribute | Importance |
|---|---|
| Price | 42% |
| Brand | 25% |
| Delivery Speed | 18% |
| Warranty | 15% |
This answers:
“What matters most?”
Preference Drivers (Utilities)
Sentink calculates utility-based preference effects for each attribute level.
This shows:
- Which levels increase attractiveness
- Which levels reduce preference
- Which combinations create stronger market appeal
Preference Share Simulation
Sentink estimates hypothetical preference shares between concepts.
This helps answer:
“If these products competed together, which one would customers prefer?”
Interactive Market Simulator
Users can:
- Change pricing
- Modify features
- Add competitors
- Remove concepts
- Enable “None of these”
- Compare multiple SKUs
The simulator recalculates preference shares dynamically.
Segment Comparison Analysis
Compare conjoint behavior across audience groups.
Example:
- Younger audiences prioritize convenience
- Older audiences prioritize reliability
Sentink visualizes:
- Importance differences
- Utility shifts
- Segment behavior patterns
Price Tuning Analysis
When price attributes are included, Sentink can estimate:
- Preferred pricing zones
- Share-versus-price behavior
- Revenue opportunity indicators
These insights are directional and designed for strategic decision-making.
Demand Curves
Sentink can generate simplified demand curves showing:
- Preference share versus price
- Competitive response behavior
- Sensitivity ranges
This helps identify:
- Pricing cliffs
- Elasticity signals
- Optimal positioning zones
AI-Powered Insights
Sentink can generate executive-style AI summaries from conjoint outputs.
These may include:
- Key findings
- Strategic opportunities
- Risk indicators
- Pricing recommendations
- Product positioning insights
The AI layer is built on structured analytical outputs rather than generic text generation.
Why Conjoint Analysis Matters
Conjoint analysis helps organizations reduce uncertainty when making decisions about:
- Product design
- Pricing
- Packaging
- Feature prioritization
- Bundling
- Subscription plans
- Market positioning
Instead of relying on assumptions, teams can simulate realistic customer trade-offs and measure likely market preference behavior.
Conjoint Analysis With Sentink
Sentink combines:
- Survey creation
- Advanced conjoint analytics
- AI-powered reporting
- Interactive simulation
- Segmentation
- Executive insights
inside one unified platform.
This allows research, CX, product, and strategy teams to move from collecting opinions to testing realistic business decisions with AI-assisted analytics.
Transparent Cloud plans and private deployment—pick what fits your team.
See pricingPeople also read
Picked from the same category and shared topics.
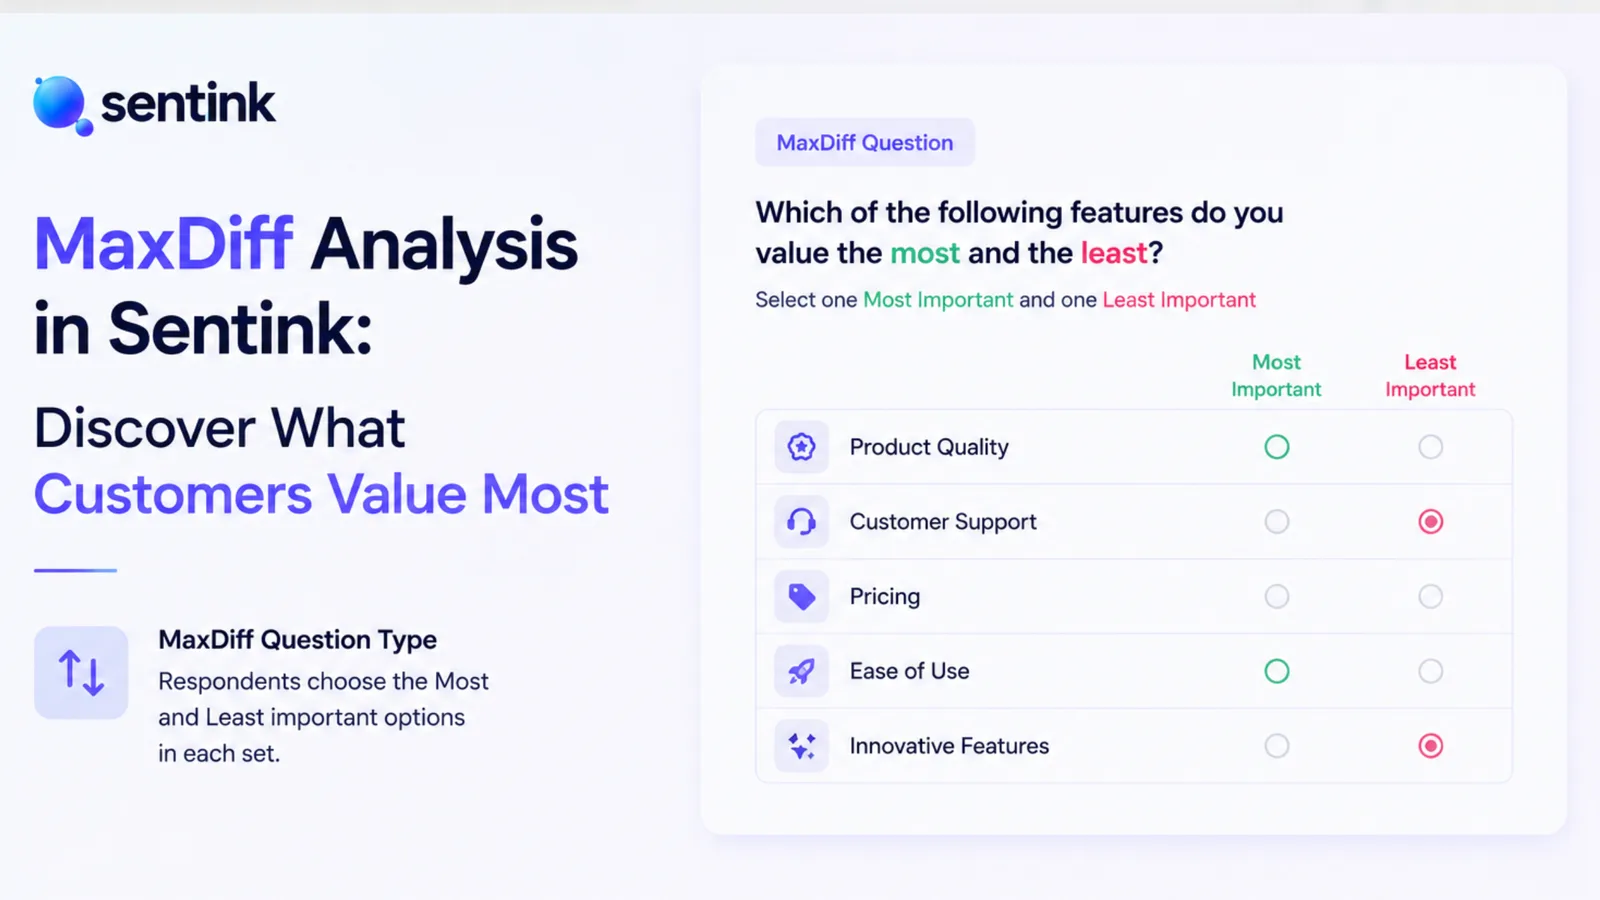
Learn how Sentink uses MaxDiff analysis to identify the most important features, messages, products, and priorities using best-worst preference modeling and AI-powered analytics.

Discover how real estate companies and property managers use Sentink to collect tenant feedback, analyze sentiment, automate reporting, and improve property experiences using AI-powered analytics.

Discover how nonprofit organizations use Sentink to measure impact, collect community feedback, analyze sentiment, automate reporting, and improve decision-making using AI-powered analytics.

Discover how retail stores, restaurants, hotels, and hospitality brands use Sentink to improve customer satisfaction, analyze sentiment, automate reporting, and modernize guest experience analytics using AI-powered insights.

Discover how schools, universities, and educational institutions use Sentink to collect student feedback, improve learning experiences, analyze sentiment, and automate reporting using AI-powered analytics.

Discover how Sentink helps healthcare organizations collect patient feedback, analyze sentiment, automate reporting, improve patient experience, and modernize healthcare analytics using AI-powered survey intelligence.