
MaxDiff Analysis in Sentink: Discover What Customers Value Most
When organizations need to prioritize a long list of ideas, features, products, or messages, traditional rating questions often fail.
Why?
Because respondents tend to rate too many items as:
- “Very important”
- “Important”
- or “Good”
This creates weak differentiation and unclear priorities.
This is where MaxDiff Analysis becomes one of the most effective research techniques for understanding true customer preference strength.
What Is MaxDiff Analysis?
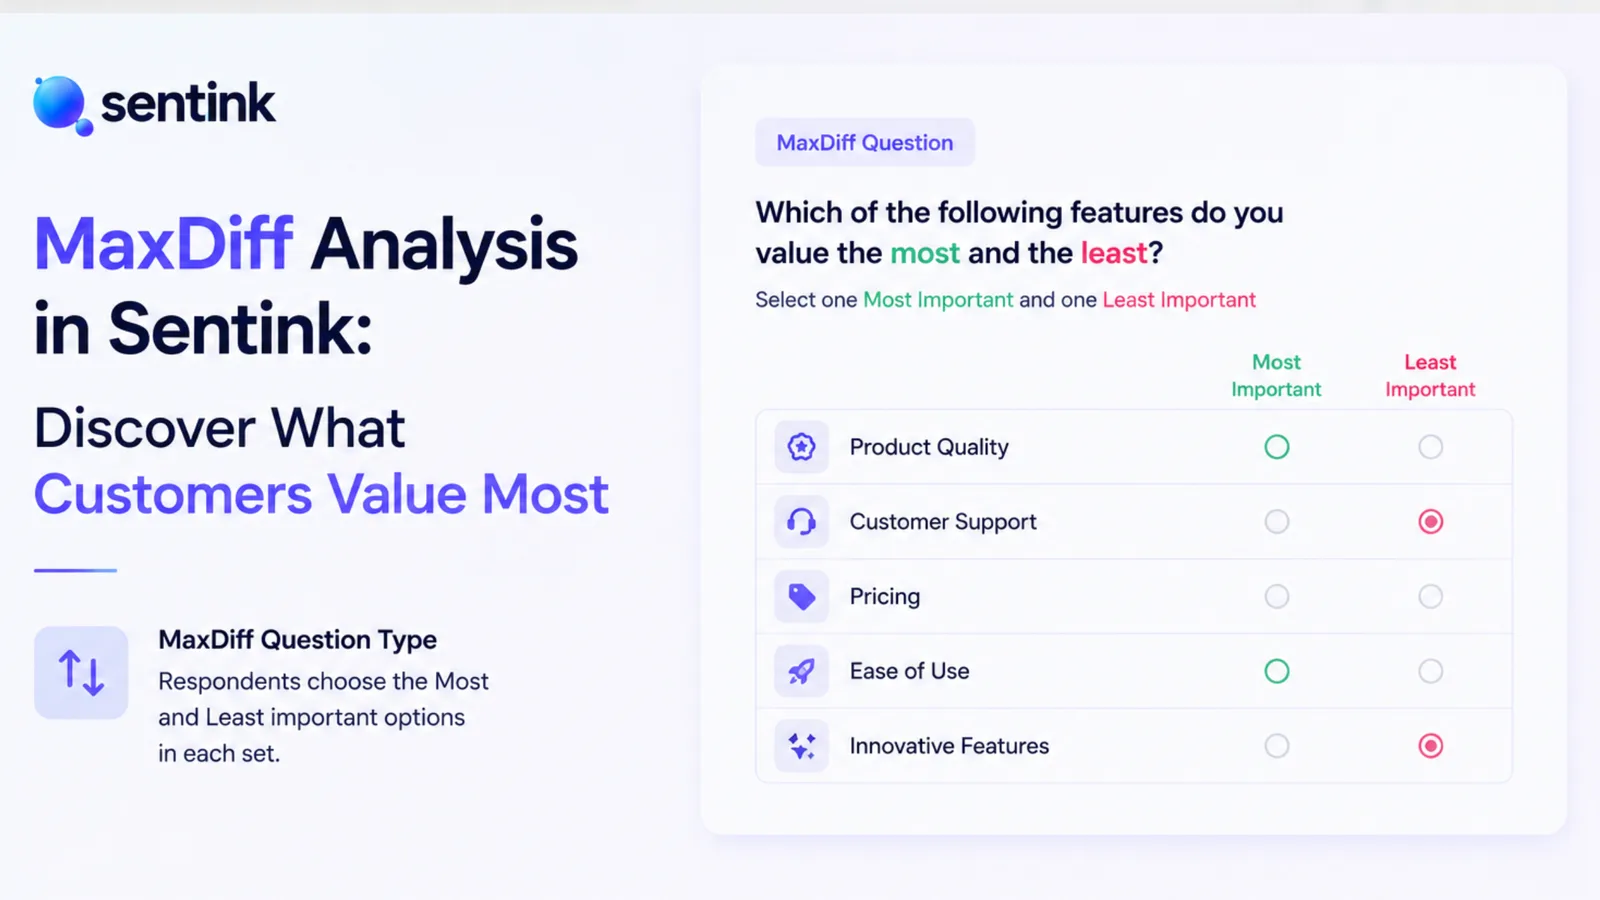
MaxDiff, also known as Best-Worst Scaling, is a methodology used to identify which items people value most — and least.
Instead of rating items independently, respondents are shown small groups of items and asked to choose:
- The most important
- The least important
from each set.
This creates stronger trade-offs and clearer prioritization compared to traditional rating scales.
MaxDiff Inside Sentink
Sentink supports advanced MaxDiff (Best-Worst) studies directly inside the platform.
In each task, respondents see a subset of items and select:
- The “Best”
- The “Worst”
The same item cannot be selected for both.
Multiple tasks are shown across the study to create balanced preference comparisons.
How Sentink Processes MaxDiff Data
Sentink aggregates:
- Best selections
- Worst selections
- Weighted response counts
For each item, the platform calculates:
Net Preference Score
Net = Weighted Best Count − Weighted Worst Count
Items are then ranked from highest to lowest net preference.
The platform clearly presents this as:
- An aggregate preference model
- A directional analytical approach
- A business-focused interpretation layer
rather than individual-level hierarchical Bayesian estimation.
Real Business Use Cases
Product Feature Prioritization
Understand which product capabilities customers care about most.
Example:
- AI reporting
- Automation
- Dashboard sharing
- Mobile access
- API integrations
MaxDiff reveals which features create the strongest preference impact.
Brand Messaging & Advertising Research
Test:
- Headlines
- Value propositions
- Marketing claims
- Brand positioning statements
to identify which messages resonate most strongly with audiences.
Product Roadmap Decisions
Compare potential future investments before development begins.
This helps teams prioritize:
- High-impact ideas
- Low-value requests
- Strategic opportunities
without building full conjoint experiments.
Customer Experience Priorities
Organizations can evaluate:
- Service quality
- Delivery speed
- Support responsiveness
- Ease of use
- Reliability
to identify the strongest drivers of satisfaction.
Public Sector & Policy Research
MaxDiff is commonly used to prioritize:
- Public services
- Citizen concerns
- Infrastructure investments
- Government initiatives
through clearer comparative preference measurement.
Portfolio Reach & Coverage Analysis
Sentink includes portfolio-style reach analysis inspired by TURF methodologies.
This helps organizations identify:
- Which combination of offers reaches the widest audience
- Which items overlap heavily
- Which portfolio maximizes unduplicated preference coverage
Types of Analysis Available in Sentink
Net Preference Analysis
A ranked visualization showing which items are selected as:
- “Best” more often than “Worst”
Higher scores indicate stronger overall preference.
This answers:
“Which items win repeated best-vs-worst comparisons?”
Best vs Worst Comparison Charts
Sentink separates:
- Weighted Best counts
- Weighted Worst counts
for each item.
This helps identify:
- Strongly loved items
- Polarizing items
- Frequently rejected items
An item may receive:
- High Best counts
- but also high Worst counts
revealing potential audience polarization.
Results Tables
Detailed tables include:
- Item
- Best count
- Worst count
- Net score
Optionally, Sentink can estimate exploratory confidence ranges using bootstrap sampling.
Portfolio Reach Analysis
Sentink calculates:
Reach
The percentage of weighted respondents who selected an item as “Best” at least once.
Greedy Portfolio Optimization
The platform can progressively select combinations of items that maximize total unduplicated audience reach.
This is conceptually similar to:
- TURF analysis
- Reach optimization studies
and helps organizations design stronger product portfolios or campaign combinations.
AI-Powered Insights
Sentink can generate AI summaries including:
- Key findings
- Strategic recommendations
- Risks
- Opportunities
- Priority interpretations
based on structured analytical outputs from the MaxDiff model.
How to Read MaxDiff Results
| Analysis | Main Question |
|---|---|
| Net Preference | Which items consistently win? |
| Best vs Worst | Is the item loved, rejected, or polarizing? |
| Reach | How many people strongly prefer this item? |
| Portfolio Analysis | Which combination covers the largest audience? |
| AI Insights | What strategic actions should teams consider? |
Why Businesses Use MaxDiff
MaxDiff helps organizations:
- Reduce prioritization bias
- Force realistic trade-offs
- Discover stronger preference signals
- Avoid inflated rating scales
- Simplify decision-making
It is especially powerful when testing:
- Features
- Messaging
- Benefits
- Product concepts
- Service priorities
- Strategic initiatives
MaxDiff Analysis With Sentink
Sentink combines:
- Survey creation
- Best-Worst preference analysis
- AI-powered reporting
- Portfolio optimization
- Segment analysis
- Executive insights
inside one unified platform.
This allows research, CX, product, and strategy teams to move beyond simple ratings and uncover what truly matters most to their audiences.
Transparent Cloud plans and private deployment—pick what fits your team.
Get Started FreePeople also read
Picked from the same category and shared topics.
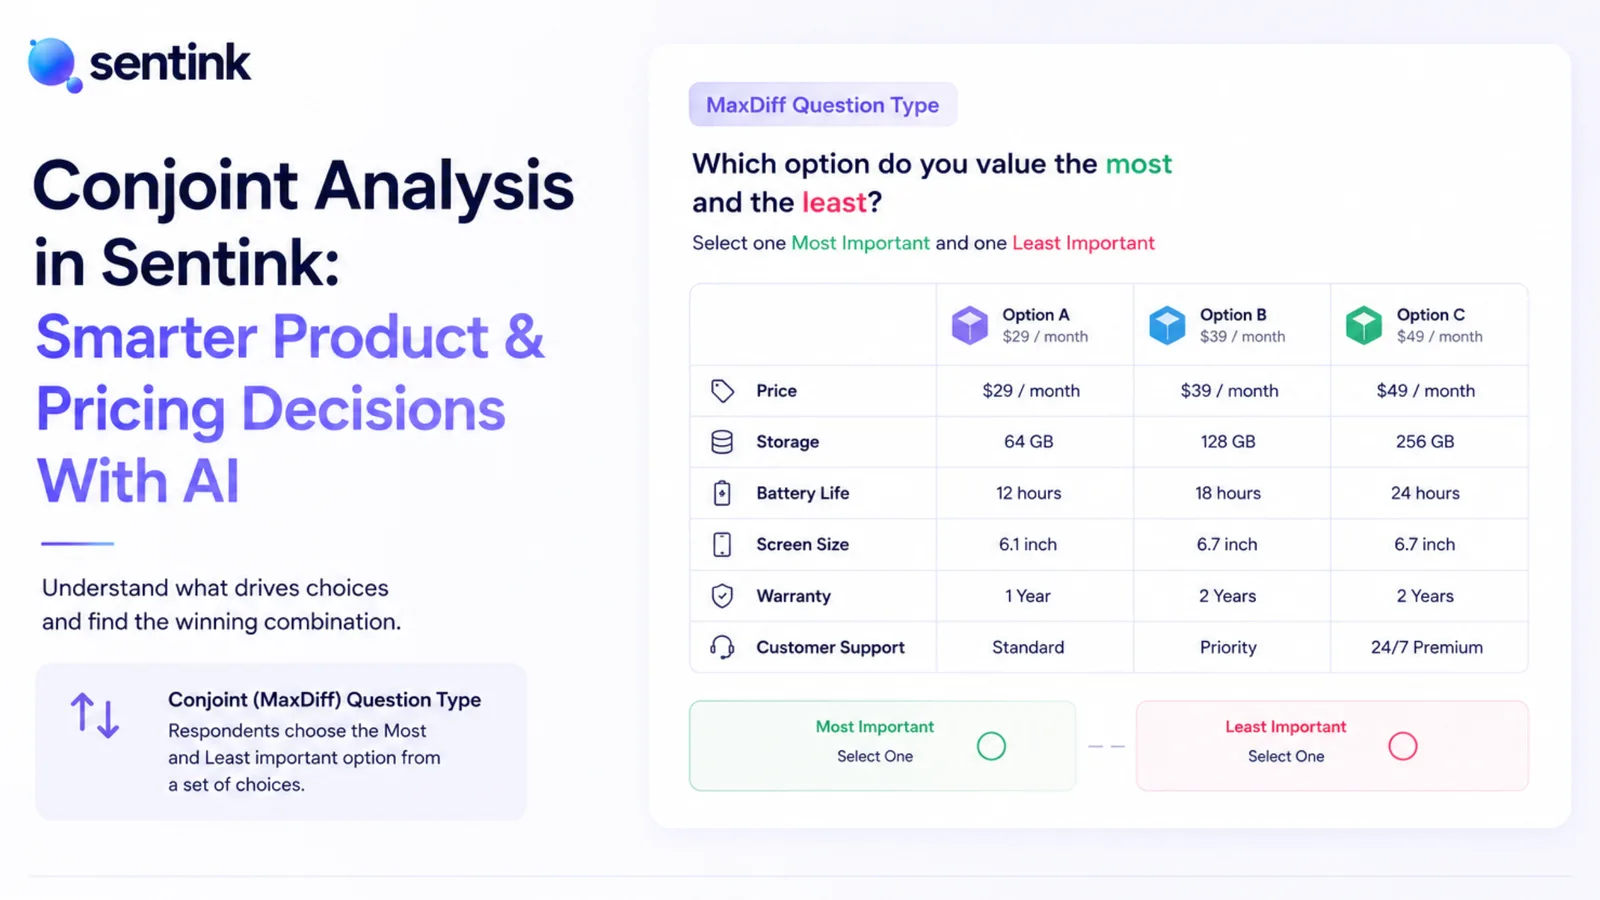
Learn how Sentink helps teams use Conjoint Analysis to optimize pricing, product features, positioning, and customer preference simulation using AI-powered analytics.

Discover how real estate companies and property managers use Sentink to collect tenant feedback, analyze sentiment, automate reporting, and improve property experiences using AI-powered analytics.
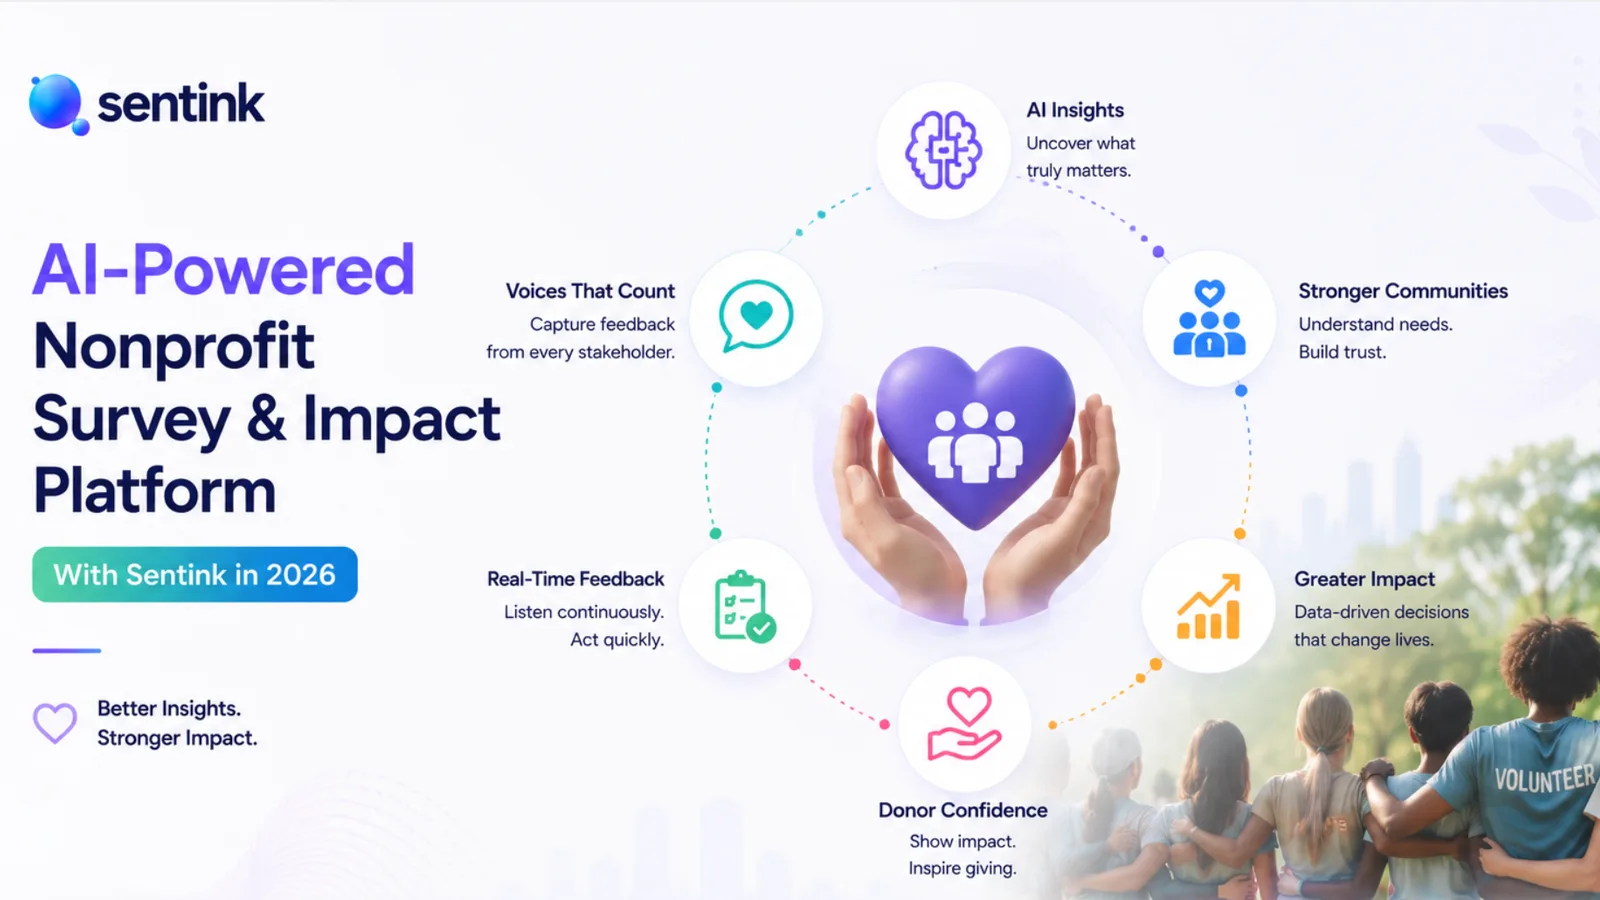
Discover how nonprofit organizations use Sentink to measure impact, collect community feedback, analyze sentiment, automate reporting, and improve decision-making using AI-powered analytics.
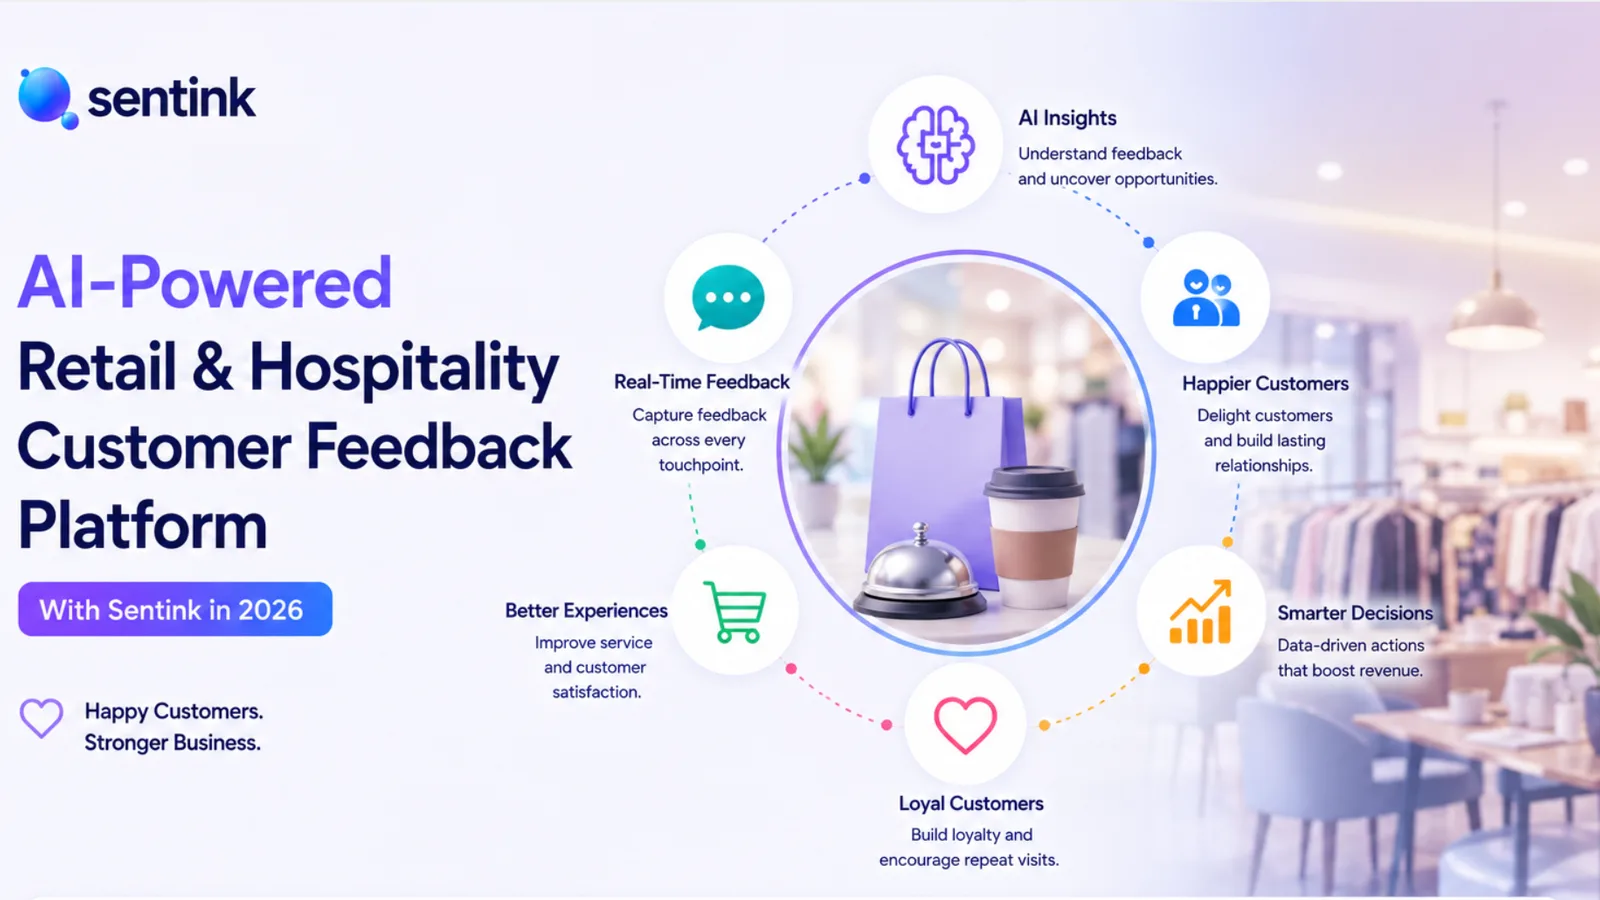
Discover how retail stores, restaurants, hotels, and hospitality brands use Sentink to improve customer satisfaction, analyze sentiment, automate reporting, and modernize guest experience analytics using AI-powered insights.
Discover how schools, universities, and educational institutions use Sentink to collect student feedback, improve learning experiences, analyze sentiment, and automate reporting using AI-powered analytics.

Discover how Sentink helps healthcare organizations collect patient feedback, analyze sentiment, automate reporting, improve patient experience, and modernize healthcare analytics using AI-powered survey intelligence.