
How To Create Executive Survey Reports Using AI in 2026
How To Create Executive Survey Reports Using AI in 2026
Modern organizations collect massive amounts of survey data every day.
This data often includes:
- customer feedback
- employee surveys
- NPS and CSAT programs
- operational research
- market studies
- open-ended comments
- sentiment analysis
But one of the biggest challenges is:
turning survey data into executive-ready reports
Traditional reporting workflows often require:
- spreadsheets
- PowerPoint presentations
- manual charts
- written summaries
- analyst interpretation
- hours or days of work
As organizations collect more data, traditional reporting becomes:
- slower
- more expensive
- difficult to scale
- heavily dependent on analysts
This is why AI-powered reporting platforms like Sentink are rapidly transforming how organizations create executive survey reports.
In this article, we explain:
- what executive survey reports are
- what makes a good executive report
- common reporting mistakes
- how AI automates reporting workflows
- how conversational analytics changes reporting
- the future of intelligent reporting systems
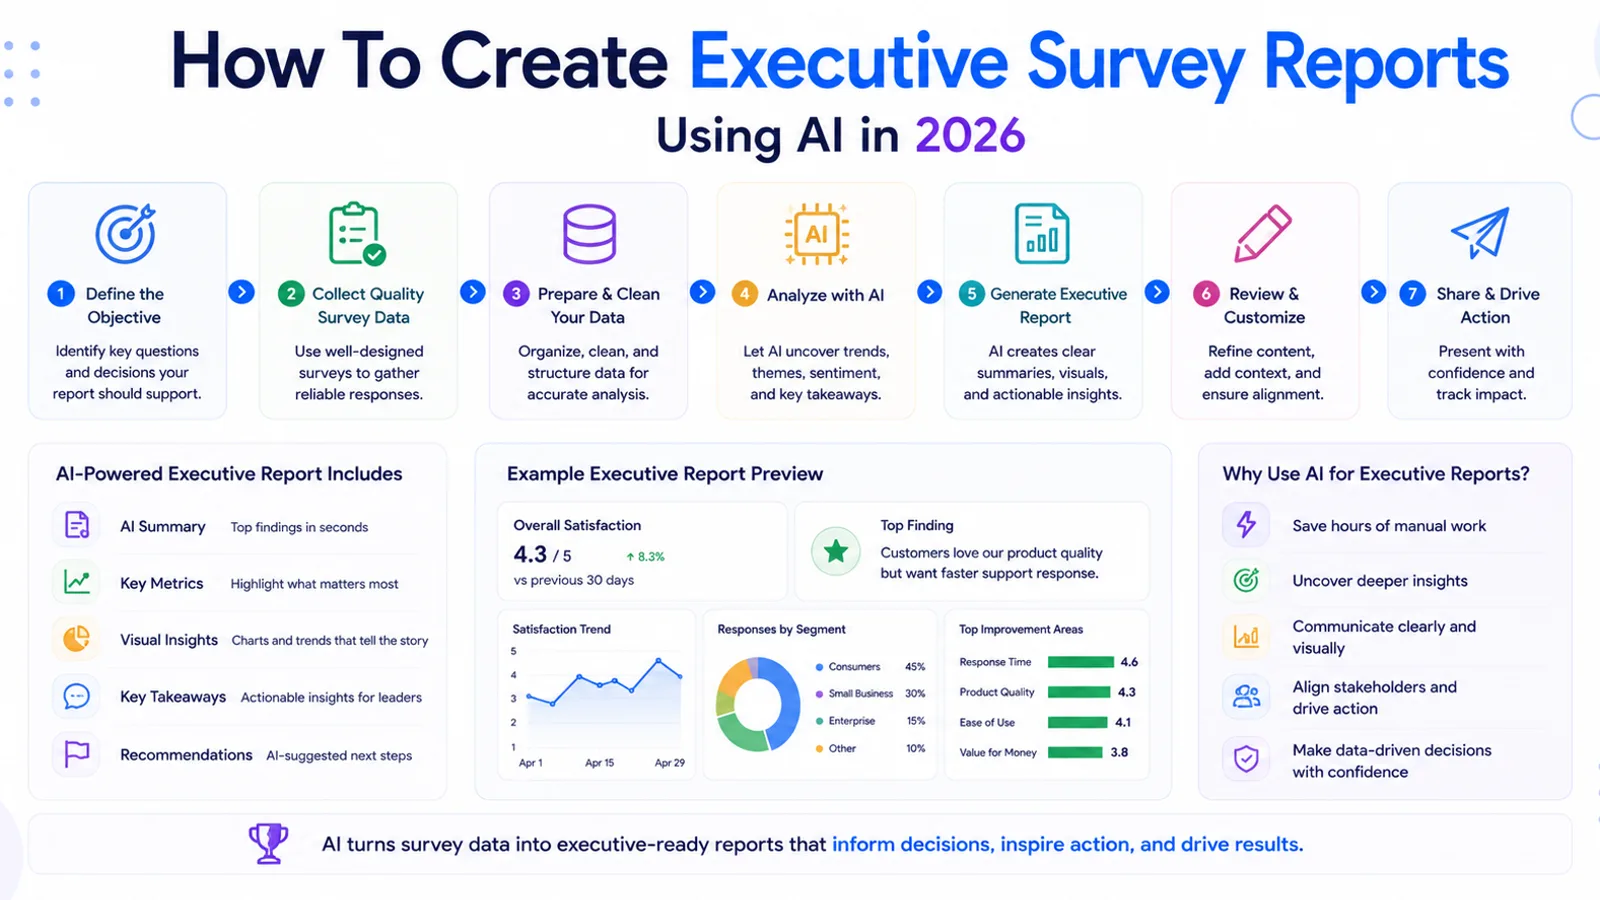
What Is an Executive Survey Report?
An executive survey report is a high-level report designed to help leadership teams understand:
- key insights
- major trends
- operational risks
- customer sentiment
- employee feedback
- strategic opportunities
Unlike detailed analyst reports, executive reports focus on:
- clarity
- simplicity
- strategic insights
- decision-making
The goal is not to overwhelm executives with data.
The goal is to help them:
understand what matters most
quickly and clearly.
Why Executive Reporting Matters
Modern organizations make strategic decisions based on:
- customer feedback
- employee engagement
- operational intelligence
- market research
- customer satisfaction
Without effective reporting:
- important insights may be missed
- trends may go unnoticed
- risks may remain hidden
- decisions may become slower
Executive reporting helps organizations:
- simplify complex data
- highlight key issues
- prioritize decisions
- improve communication
- support leadership teams
Good reporting transforms:
survey data → strategic intelligence
What Makes a Good Executive Report?
A good executive report should be:
- clear
- concise
- visual
- actionable
- insight-focused
The best reports focus on:
- key findings
- trends
- recommendations
- operational risks
- business impact
Executives rarely want:
- raw spreadsheets
- hundreds of charts
- overly technical analysis
Instead, they need:
- summarized insights
- decision-ready information
- visual storytelling
- business context
Essential Elements of Executive Survey Reports
1. Executive Summary
The executive summary is the most important section.
It should quickly explain:
- major findings
- key trends
- critical risks
- opportunities
- strategic recommendations
Modern AI systems increasingly generate executive summaries automatically.
Platforms like Sentink help organizations automate this process using AI-powered reporting workflows.
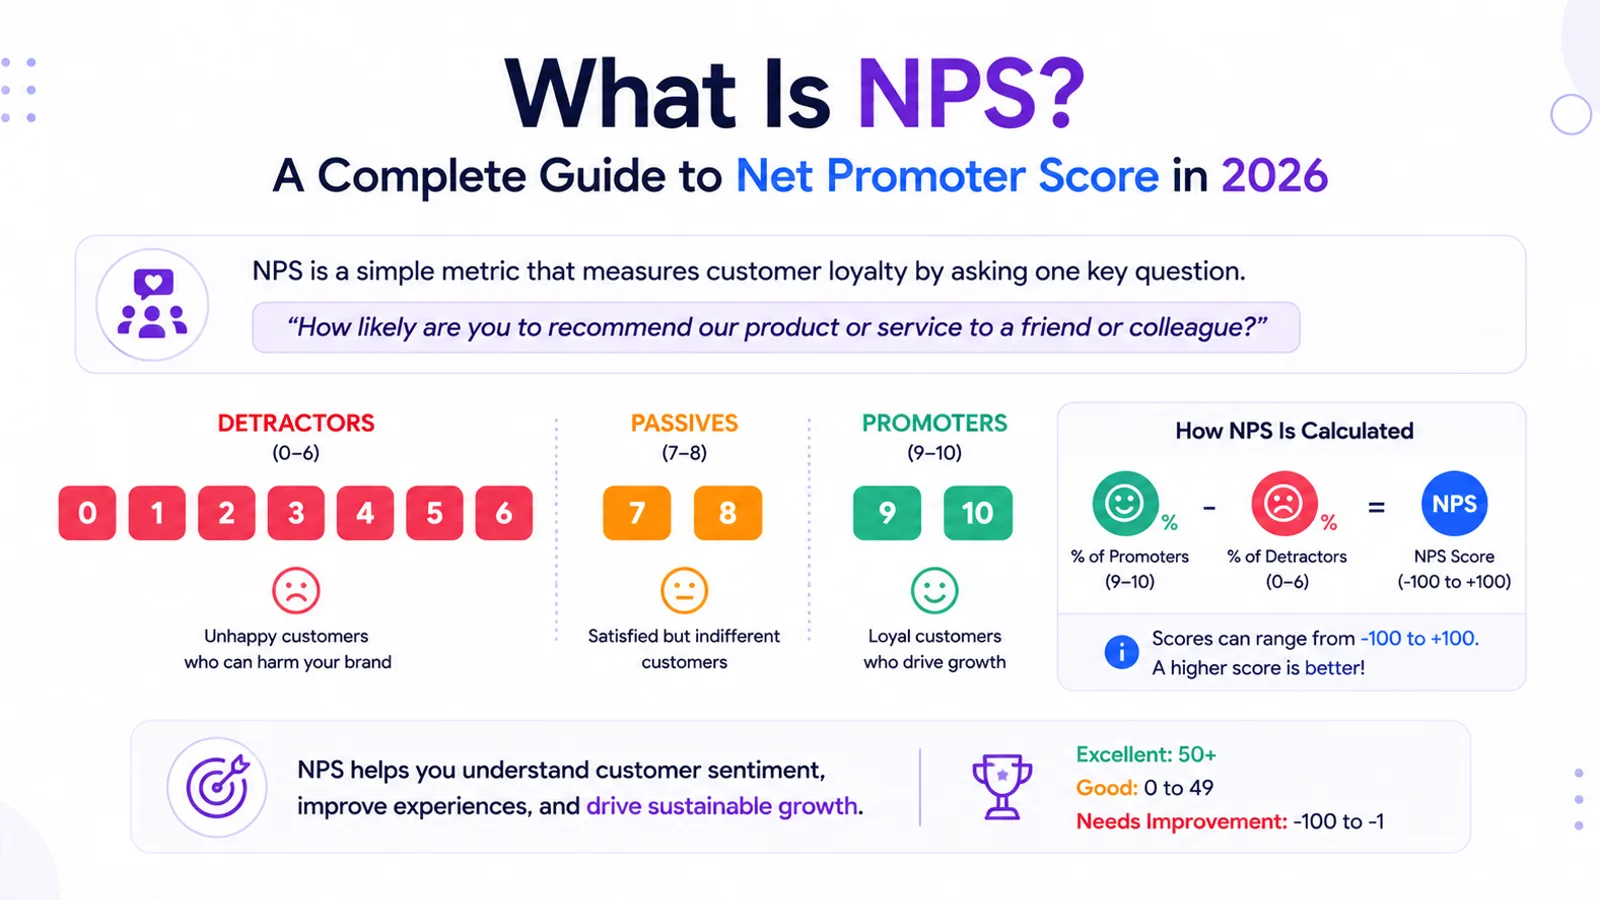
2. KPI Metrics
Reports should clearly display important metrics such as:
- NPS
- CSAT
- response rates
- engagement scores
- satisfaction trends
This helps leadership teams understand performance quickly.
3. Trend Analysis
Trend analysis helps executives understand:
- what changed
- where problems are growing
- which improvements are working
- how customer sentiment evolves
Trend visualization is critical for strategic planning.
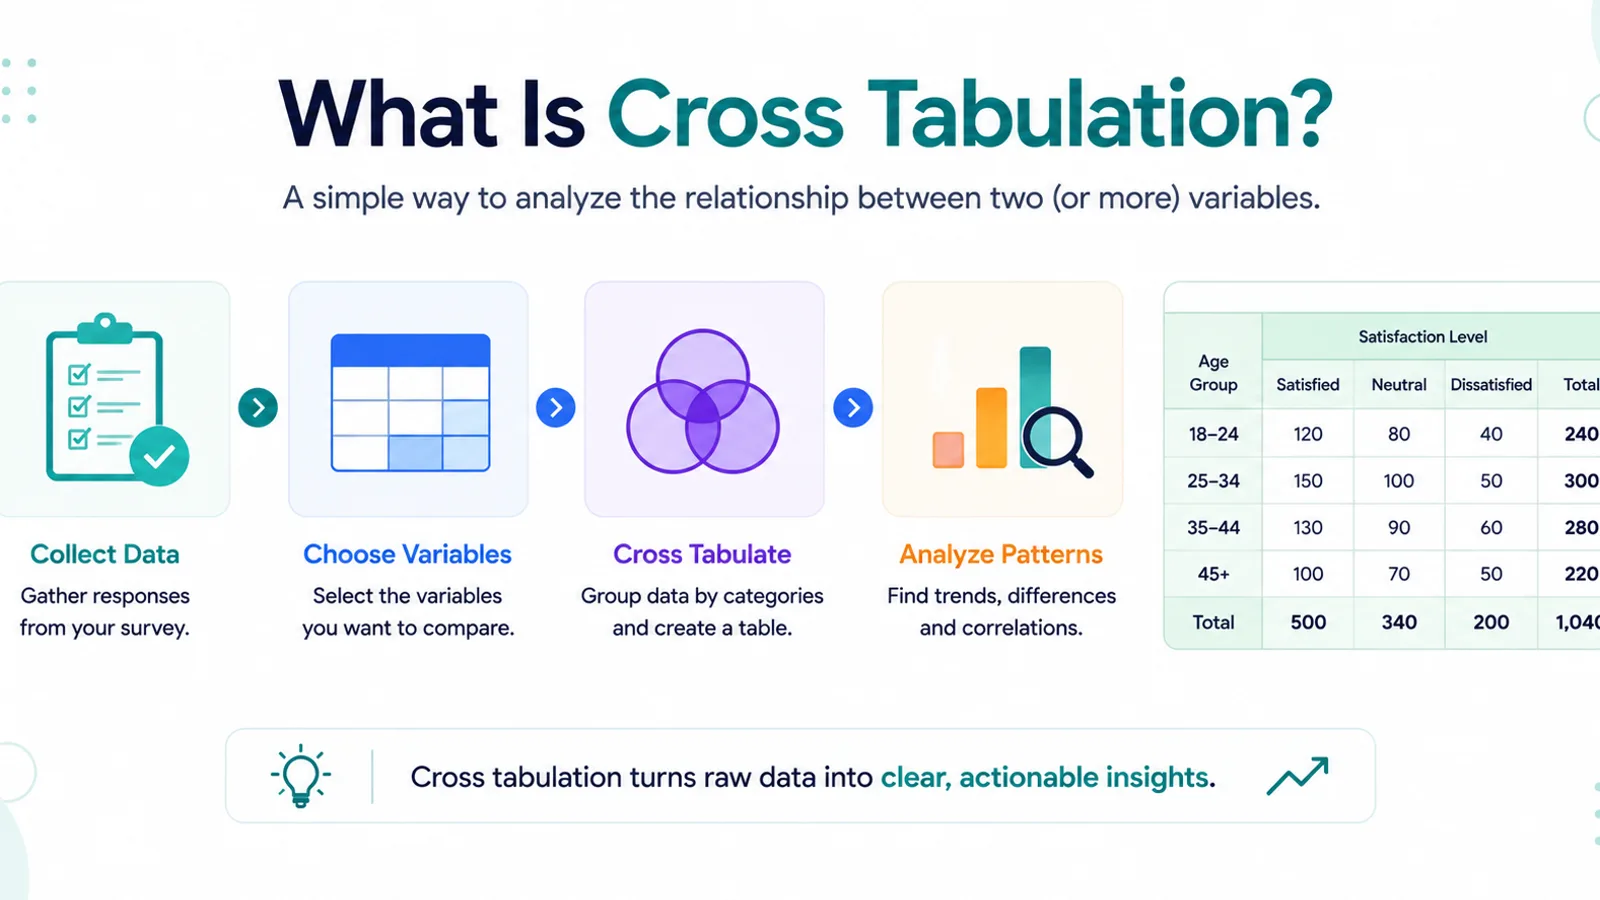
4. Cross-Tab Insights
Cross-tabulation helps organizations compare:
- regions
- departments
- customer segments
- demographics
- behavioral groups
AI-powered systems increasingly explain cross-tab insights automatically.
This dramatically simplifies advanced analytics for leadership teams.
5. Sentiment Analysis
Modern executive reports increasingly include:
Sentiment Analysis
AI systems can automatically:
- summarize customer emotions
- detect frustration
- identify recurring complaints
- explain satisfaction drivers
- highlight emotional trends
This creates deeper business understanding.
Platforms like Sentink increasingly integrate AI-powered sentiment intelligence directly into executive reporting.
Common Executive Reporting Mistakes
Many organizations create reports that are:
- too long
- overloaded with charts
- difficult to understand
- overly technical
- disconnected from business goals
Common mistakes include:
- too much raw data
- poor storytelling
- lack of prioritization
- weak visual hierarchy
- unclear recommendations
Good executive reporting should:
simplify decisions — not complicate them
AI and Automated Reporting
Traditional reporting often requires:
- analysts
- designers
- PowerPoint presentations
- manual summaries
- repetitive workflows
Modern AI systems increasingly automate much of this process.
AI-powered reporting platforms can:
- generate summaries automatically
- explain findings conversationally
- identify trends
- detect anomalies
- highlight risks
- build executive-ready dashboards
This dramatically reduces reporting time.
Organizations can move from:
survey collection → executive intelligence
much faster.
Conversational Analytics and Reporting
One of the biggest trends in analytics today is:
Conversational Analytics
Instead of manually reviewing reports, executives can ask questions like:
- “Why did customer satisfaction decline?”
- “What are the biggest operational risks?”
- “Which department has the lowest engagement?”
- “Summarize employee complaints.”
AI systems can automatically:
- analyze the data
- generate explanations
- summarize insights
- provide recommendations
Platforms like Sentink increasingly support these “Chat with Data” experiences.
Real-Time Reporting and Decision Intelligence
Modern organizations increasingly require:
- real-time dashboards
- instant reporting
- live analytics
- automated alerts
- faster decision-making
AI-powered reporting systems help organizations:
- identify problems earlier
- react faster
- improve customer experience
- support leadership teams
- automate strategic reporting
This creates major competitive advantages.
Arabic and Multilingual Executive Reporting
Organizations operating globally increasingly require:
- multilingual reports
- Arabic dashboards
- RTL analytics
- multilingual sentiment analysis
- mixed-language reporting
Platforms like Sentink increasingly focus on multilingual and Arabic-first executive reporting workflows.
This is especially valuable for:
- Gulf organizations
- multinational enterprises
- government institutions
- customer experience teams
The Future of Executive Reporting
The future of executive reporting is rapidly moving toward:
- AI-generated insights
- conversational analytics
- intelligent dashboards
- predictive reporting
- automated summaries
- sentiment intelligence
- real-time decision support
Traditional static reports are no longer enough.
Organizations increasingly need systems that help them:
understand insights — not just read reports
This is why AI-powered survey intelligence platforms are becoming increasingly important.
Final Thoughts
Executive survey reporting remains one of the most important parts of modern business intelligence and customer experience operations.
But organizations increasingly need more than:
- spreadsheets
- static presentations
- traditional charts
They need:
- AI-generated insights
- intelligent summaries
- sentiment analysis
- conversational analytics
- automated reporting
- decision intelligence
Platforms like Sentink are helping shape the future of intelligent executive reporting and AI-powered survey analytics.
As artificial intelligence continues evolving, automated executive reporting may become one of the most important technologies in customer intelligence and strategic decision-making.
Transparent Cloud plans and private deployment—pick what fits your team.
See pricingPeople also read
Picked from the same category and shared topics.
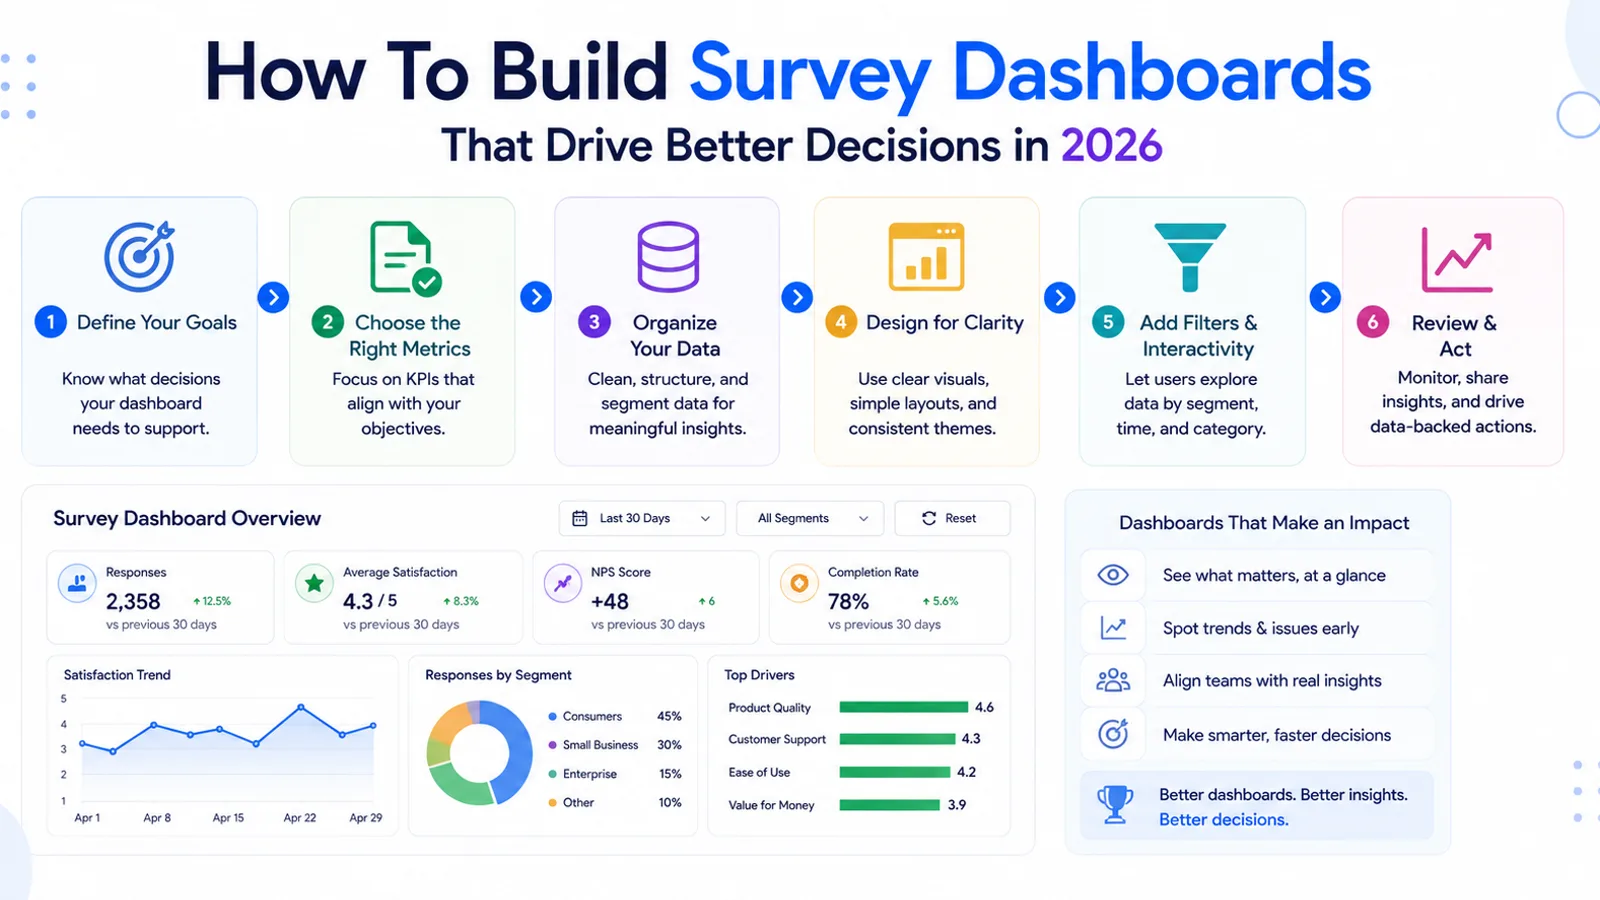
Learn how to build effective survey dashboards, visualize survey data, track customer insights, and use AI-powered analytics platforms like Sentink for intelligent reporting and decision-making.
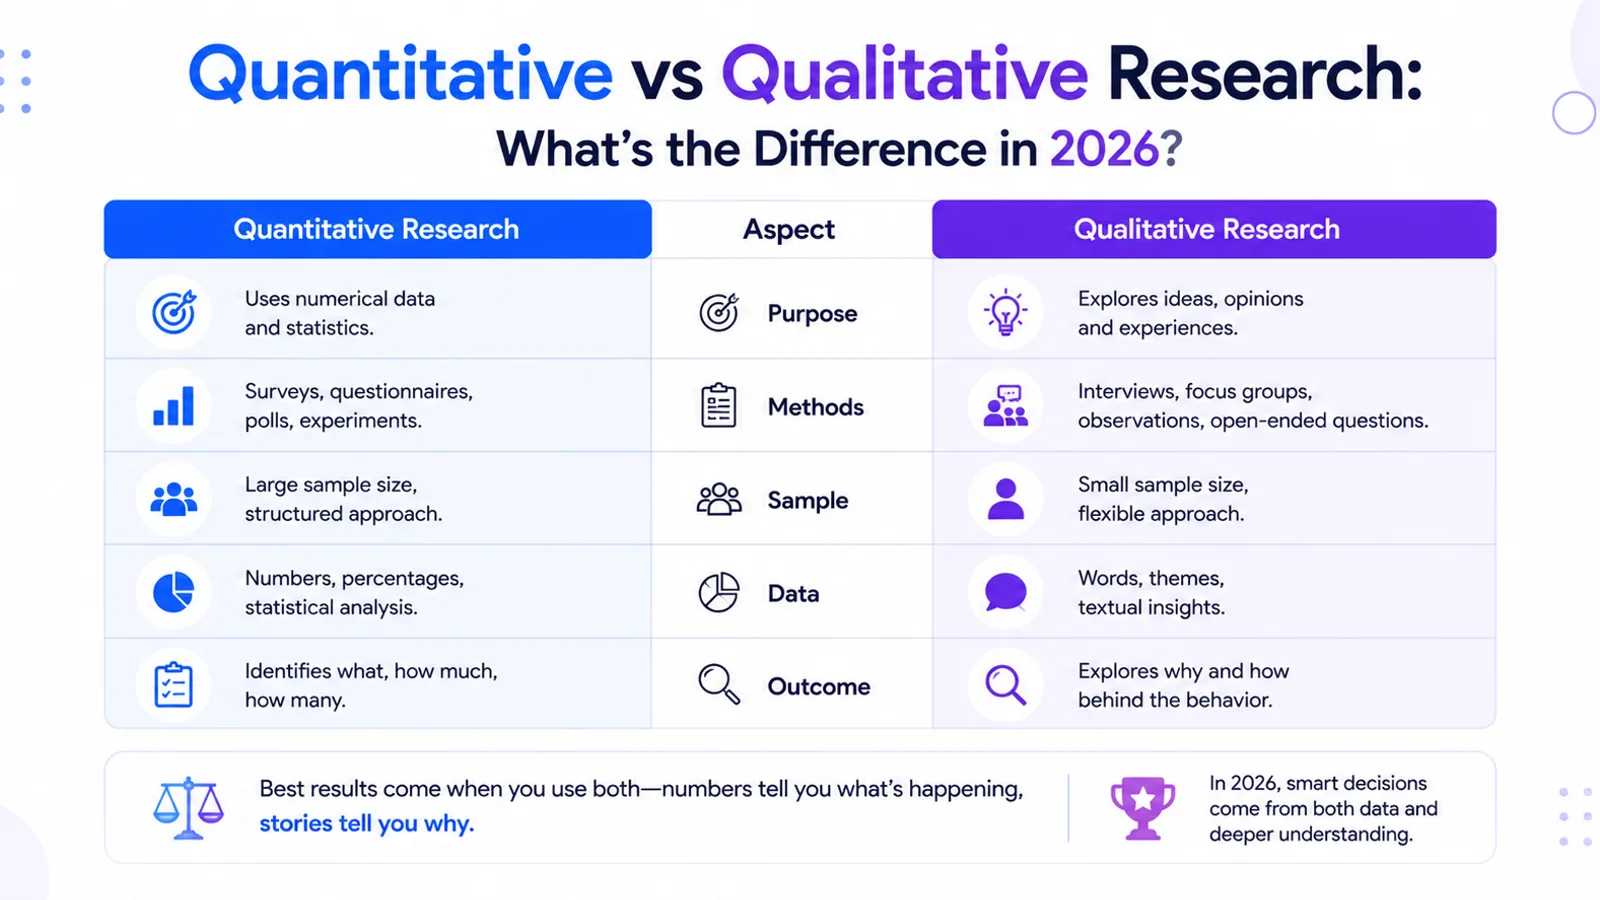
Learn the differences between quantitative and qualitative research, how organizations use both research methods, and how AI-powered platforms like Sentink modernize survey analytics and insights.
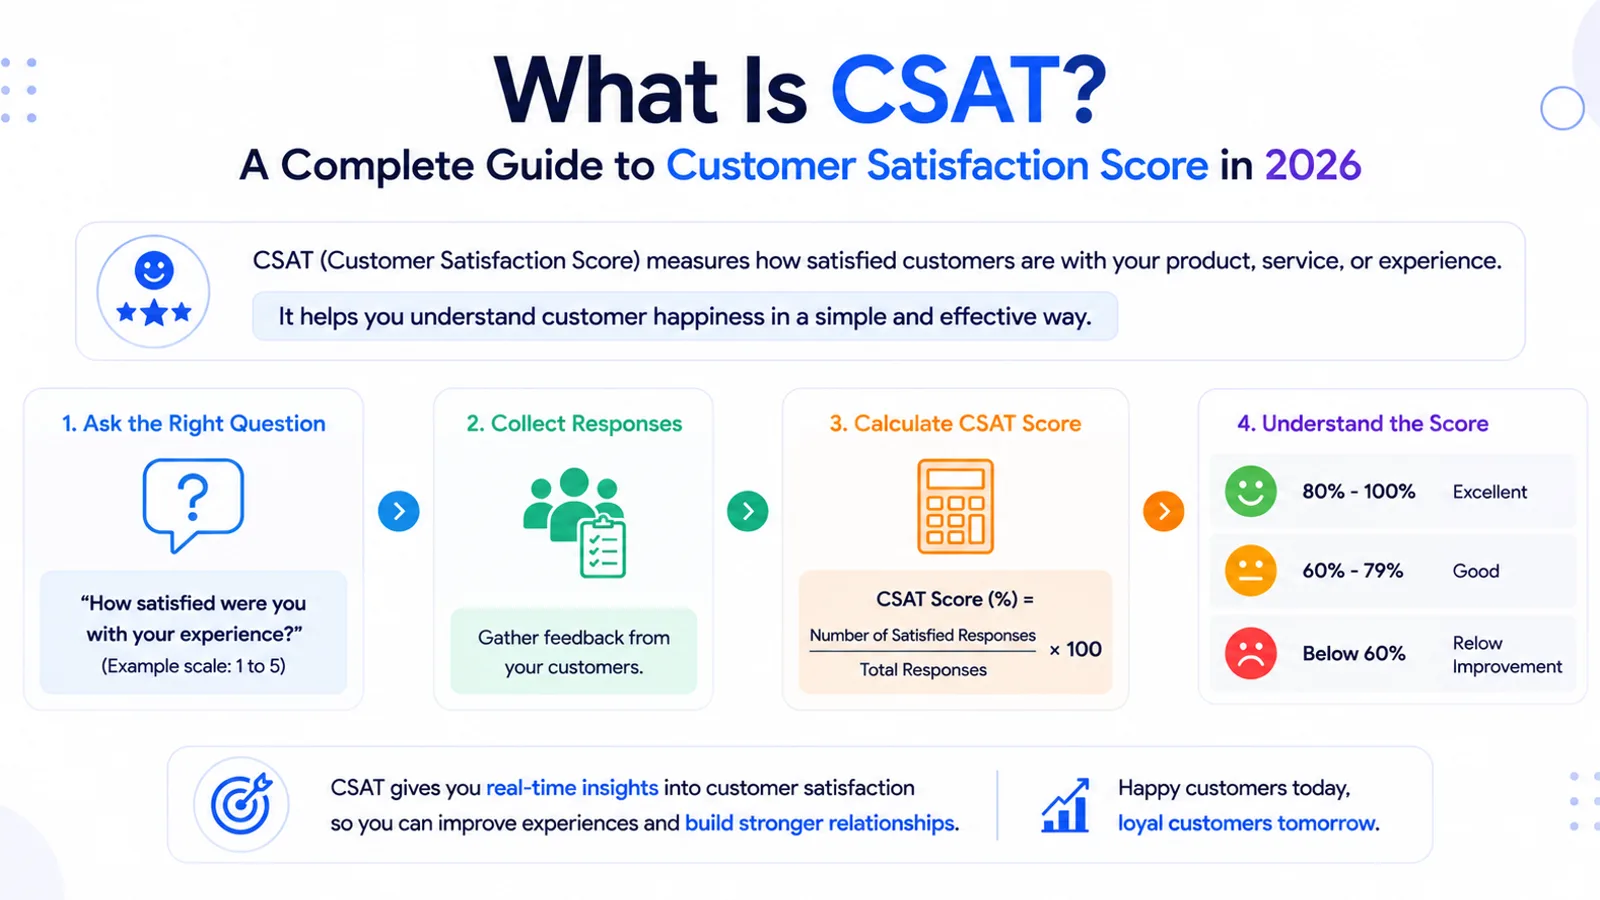
Learn what CSAT (Customer Satisfaction Score) is, how CSAT surveys work, how organizations measure customer satisfaction, and how AI-powered platforms like Sentink modernize customer experience analytics.
Learn what Net Promoter Score (NPS) is, how NPS surveys work, how organizations measure customer loyalty, and how AI-powered platforms like Sentink modernize NPS analytics and reporting.
Learn what cross tabulation is, how cross tabs work in survey research, how organizations analyze demographic differences, and how AI-powered platforms like Sentink modernize survey analytics and reporting.