
What Is Cross Tabulation? A Complete Guide to Survey Cross Tabs in 2026
What Is Cross Tabulation? A Complete Guide to Survey Cross Tabs in 2026
Modern survey research is no longer only about collecting responses.
Organizations increasingly need to:
- compare audience segments
- understand demographic differences
- analyze behavioral patterns
- identify trends
- generate deeper insights from data
One of the most important techniques used in professional survey research is:
Cross Tabulation
Also known as:
- cross tabs
- crosstabs
- contingency tables
Cross tabulation helps organizations discover relationships between variables inside survey data.
Platforms like Sentink increasingly combine cross-tabulation with AI-powered analytics, intelligent dashboards, and automated reporting workflows.
In this article, we explain:
- what cross tabulation means
- how cross tabs work
- why cross-tabs matter in survey research
- how organizations use cross-tab analysis
- how AI is modernizing cross-tab reporting
- the future of intelligent survey analytics
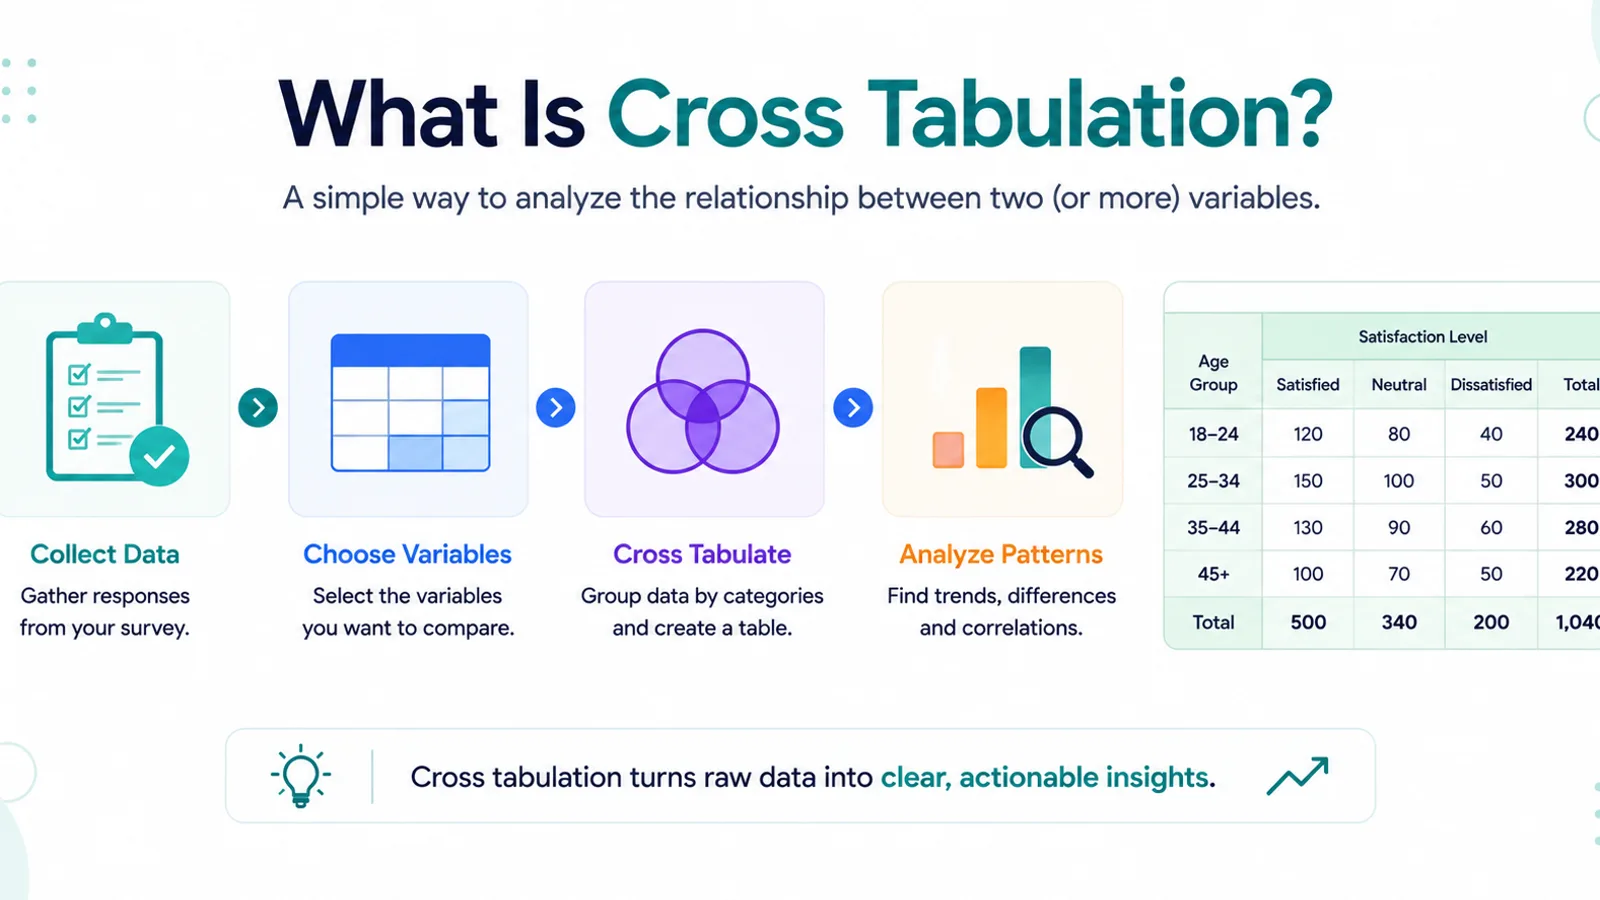
What Is Cross Tabulation?
Cross tabulation is a statistical analysis technique used to compare relationships between two or more variables in survey data.
It allows researchers to analyze how different groups respond to specific questions.
For example:
- comparing satisfaction by age group
- comparing employee sentiment by department
- comparing customer satisfaction by region
- comparing purchase behavior by gender
Cross tabs help organizations move beyond simple totals and averages into deeper audience understanding.
Simple Example of Cross Tabs
Imagine a survey question:
“Are you satisfied with our service?”
Now imagine comparing responses by:
- age group
- department
- country
- gender
- customer type
Instead of seeing only:
- 78% satisfied overall
cross-tabulation helps organizations discover insights like:
- younger customers are less satisfied
- one region has higher complaints
- enterprise customers are happier than SMB customers
- one department has lower employee morale
This creates much deeper research insights.
Why Cross Tabulation Matters
Simple survey charts often hide important patterns.
Cross-tabulation helps organizations:
- understand audience differences
- identify trends
- compare demographic segments
- detect operational issues
- improve decision-making
- generate research insights
Without cross-tabs, organizations may miss:
- hidden dissatisfaction
- regional differences
- demographic patterns
- behavioral trends
This is why cross-tabulation is considered one of the most important techniques in professional survey analytics.
Cross Tabs in Survey Research
Cross-tabulation is heavily used in:
- customer experience research
- employee engagement studies
- market research
- political polling
- healthcare surveys
- academic research
- government studies
Researchers use cross-tabs to analyze:
- satisfaction levels
- sentiment differences
- behavioral trends
- demographic insights
- response variations
Cross tabs are especially valuable when organizations collect large volumes of survey data.
Cross Tabulation vs Simple Charts
Traditional charts usually show:
- totals
- averages
- percentages
Cross-tabs go much deeper.
They help answer questions like:
- Which customer segment is least satisfied?
- Which region has the highest complaints?
- How does satisfaction differ by age?
- Which department has the strongest engagement?
This transforms survey data into actionable intelligence.
Cross Tabulation and AI Analytics
Traditional cross-tab analysis often requires:
- statistical expertise
- manual filtering
- spreadsheet work
- complex reporting
Modern AI-powered analytics platforms increasingly simplify these workflows.
Platforms like Sentink help organizations:
- generate cross-tabs automatically
- explain cross-tab results
- identify significant patterns
- summarize findings
- create visual dashboards
- automate reporting
This dramatically reduces manual analysis work.
Cross Tabs and Sentiment Analysis
Cross-tabulation becomes even more powerful when combined with:
Sentiment Analysis
Organizations can analyze:
- sentiment by region
- sentiment by department
- sentiment by age group
- sentiment by customer type
For example:
- younger customers may show more negative sentiment
- one office may have lower employee morale
- premium customers may report higher satisfaction
Platforms like Sentink increasingly combine AI-powered sentiment analysis with advanced cross-tab workflows.
AI-Powered Cross Tab Interpretation
One of the biggest challenges in traditional research is interpreting complex cross-tab data.
AI systems increasingly help organizations:
- explain cross-tab findings
- summarize important insights
- detect unusual patterns
- identify risks automatically
- generate executive summaries
This helps organizations move from:
raw survey tables → strategic insights
much faster.
Cross Tabs and Conversational Analytics
Modern analytics is rapidly moving toward:
Conversational Analytics
Instead of manually building cross-tabs, users can increasingly ask questions like:
- “Compare satisfaction by department.”
- “Which age group has the most negative sentiment?”
- “Show customer satisfaction by region.”
- “What segment has the highest engagement?”
AI systems can automatically generate:
- comparisons
- visualizations
- summaries
- insights
Platforms like Sentink increasingly support these AI-powered “Chat with Data” experiences.
Cross Tabulation and Business Intelligence
Cross-tabs are critical for modern business intelligence because they help organizations:
- understand audience behavior
- detect operational problems
- identify opportunities
- improve customer experience
- optimize employee engagement
- support strategic decisions
Organizations increasingly rely on cross-tab analytics to transform feedback into decision intelligence.
Arabic and Multilingual Cross Tabs
One major challenge in modern analytics is multilingual survey reporting.
Organizations in the Middle East often require:
- Arabic dashboards
- multilingual reports
- RTL analytics
- Arabic sentiment analysis
Platforms like Sentink increasingly focus on multilingual and Arabic-first survey analytics workflows.
This is especially valuable for:
- Gulf organizations
- government programs
- multinational enterprises
- research agencies
The Future of Cross Tabulation
Cross-tabulation is evolving rapidly through:
- artificial intelligence
- conversational analytics
- automated reporting
- intelligent dashboards
- predictive analytics
- AI-generated insights
Traditional spreadsheets alone are no longer enough.
Organizations increasingly need systems that help them:
understand relationships inside data automatically
This is why AI-powered survey intelligence platforms are becoming increasingly important.
Final Thoughts
Cross tabulation remains one of the most important techniques in survey research and analytics.
It helps organizations move beyond simple charts toward:
- deeper audience understanding
- advanced segmentation
- sentiment analysis
- strategic insights
- intelligent decision-making
Platforms like Sentink are helping modernize cross-tab analytics through AI-powered reporting, conversational analytics, and intelligent survey workflows.
As analytics continues evolving, cross-tab intelligence may become one of the most valuable tools in modern research and customer experience operations.
Transparent Cloud plans and private deployment—pick what fits your team.
See pricingPeople also read
Picked from the same category and shared topics.
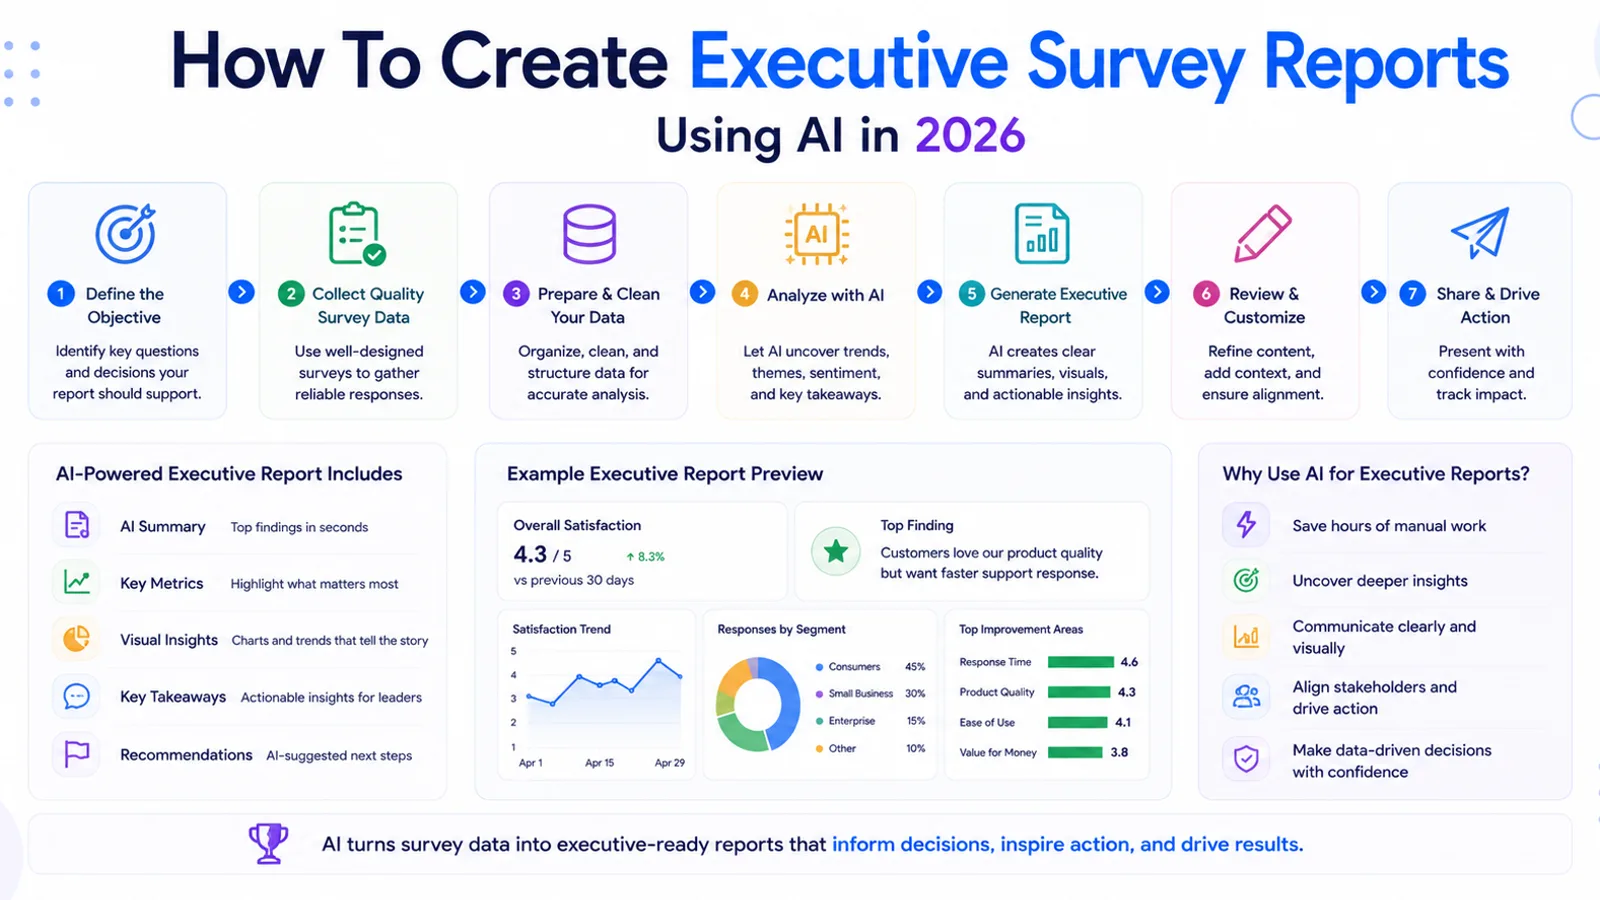
Learn how to create executive-ready survey reports using AI, automate survey reporting workflows, summarize feedback, visualize insights, and modernize analytics with platforms like Sentink.
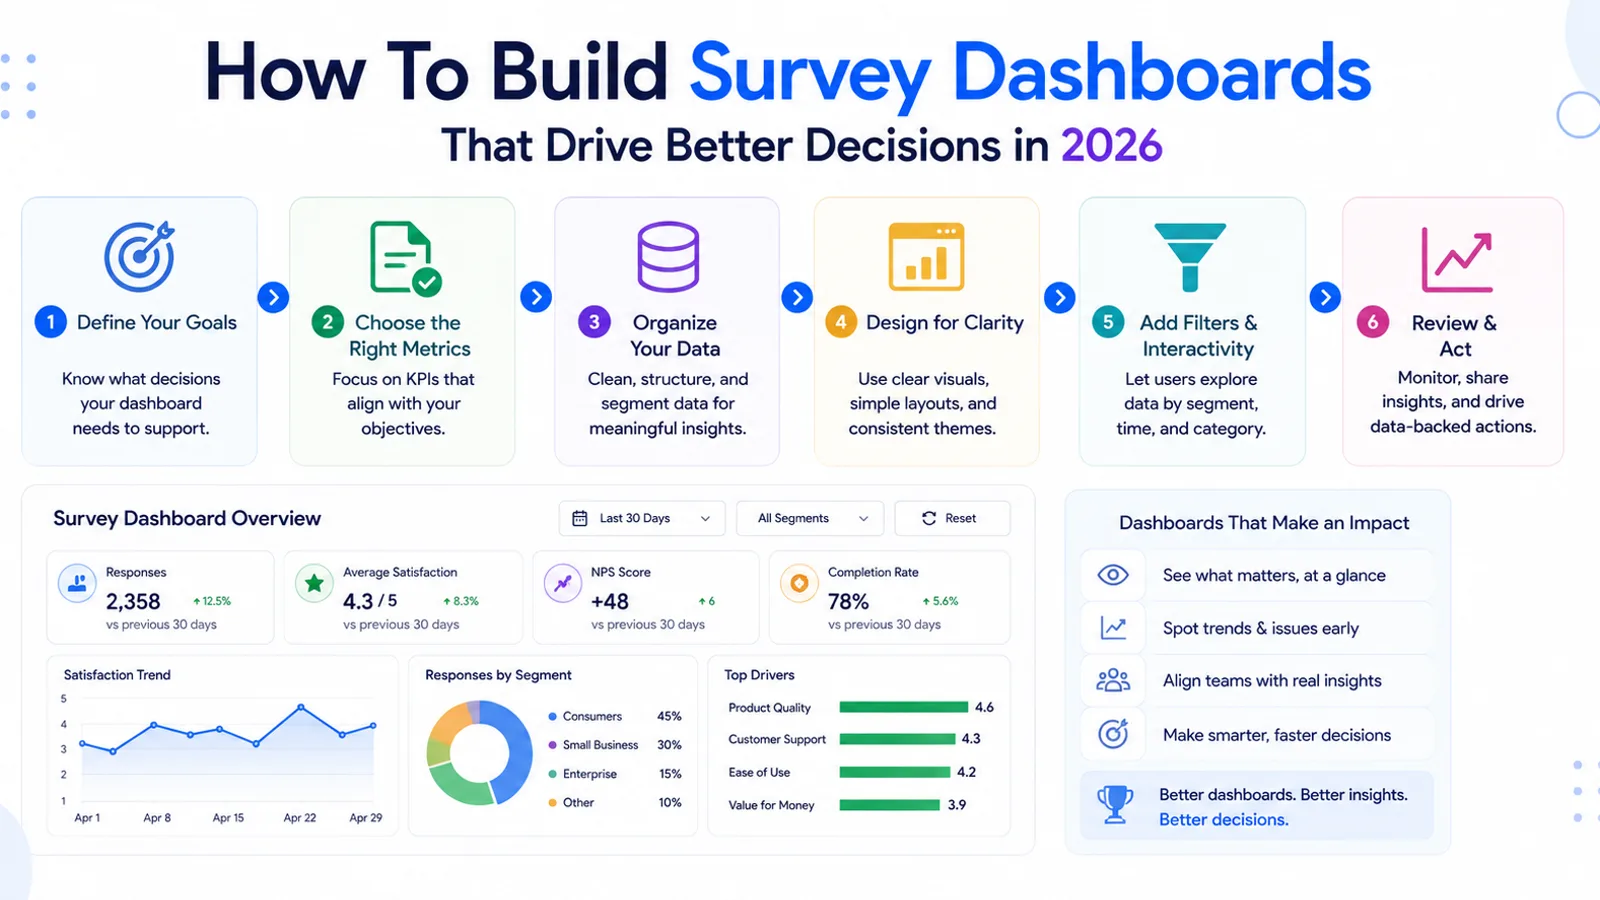
Learn how to build effective survey dashboards, visualize survey data, track customer insights, and use AI-powered analytics platforms like Sentink for intelligent reporting and decision-making.
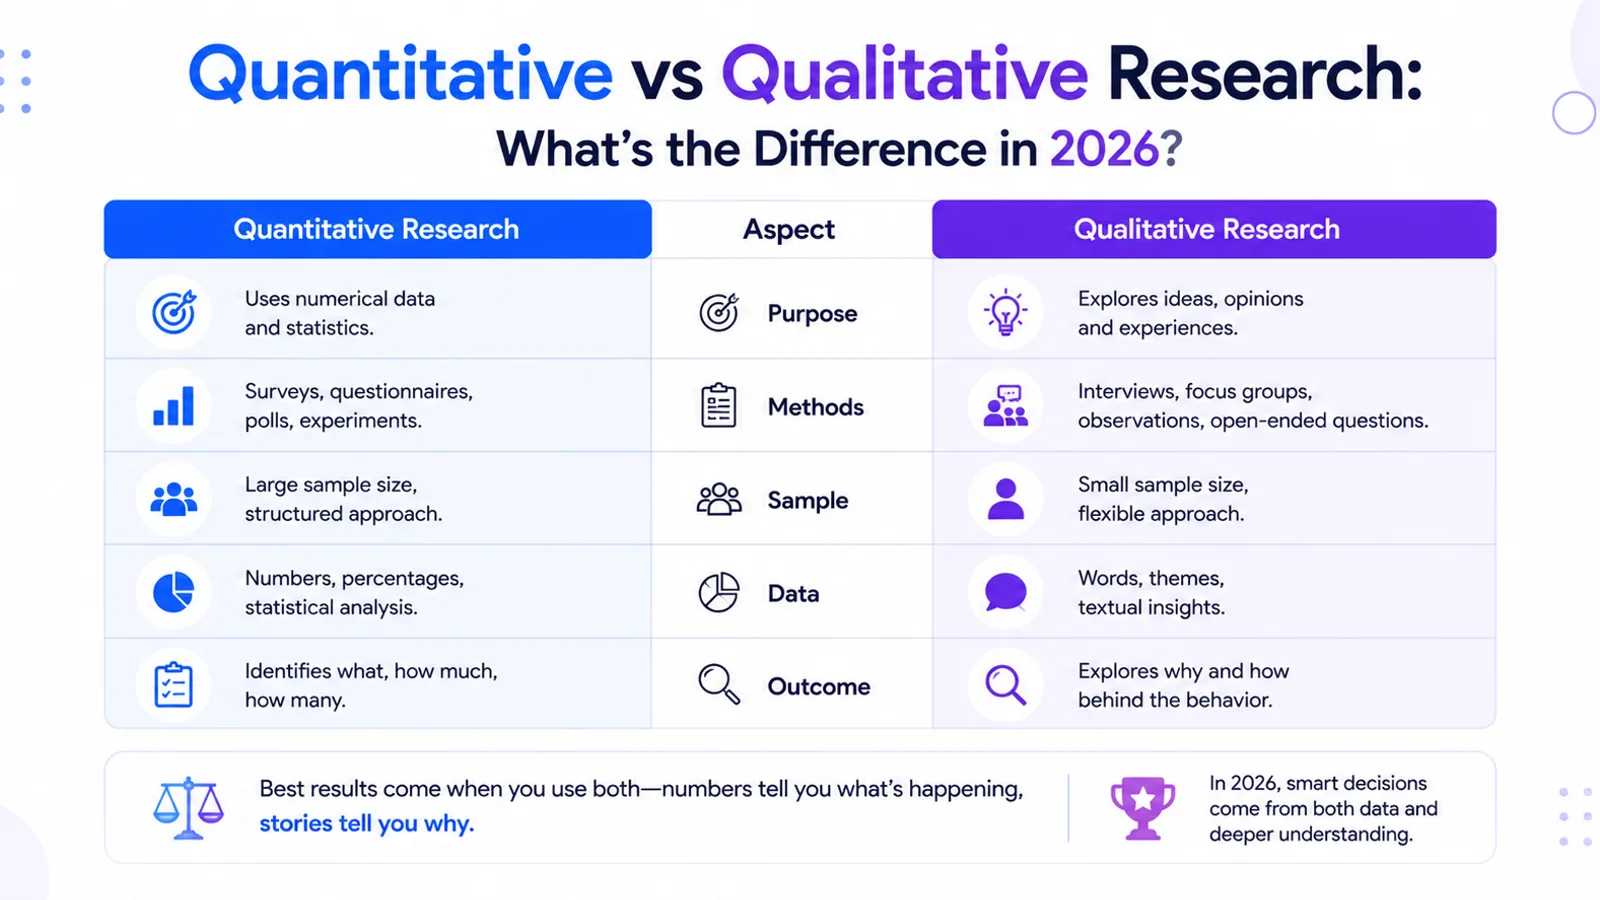
Learn the differences between quantitative and qualitative research, how organizations use both research methods, and how AI-powered platforms like Sentink modernize survey analytics and insights.
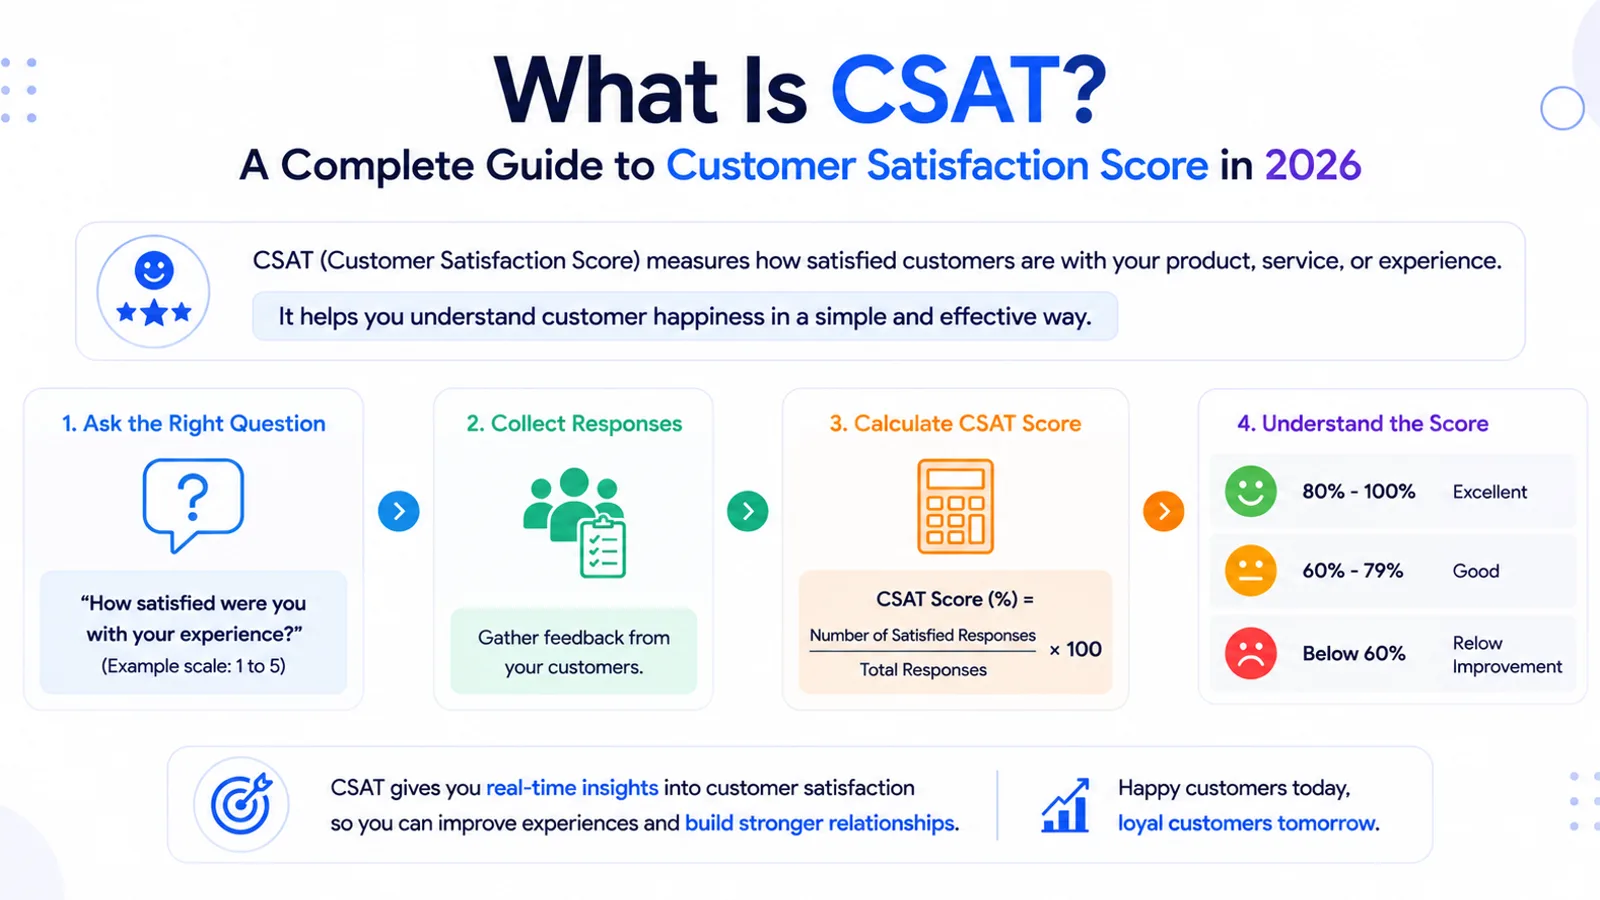
Learn what CSAT (Customer Satisfaction Score) is, how CSAT surveys work, how organizations measure customer satisfaction, and how AI-powered platforms like Sentink modernize customer experience analytics.
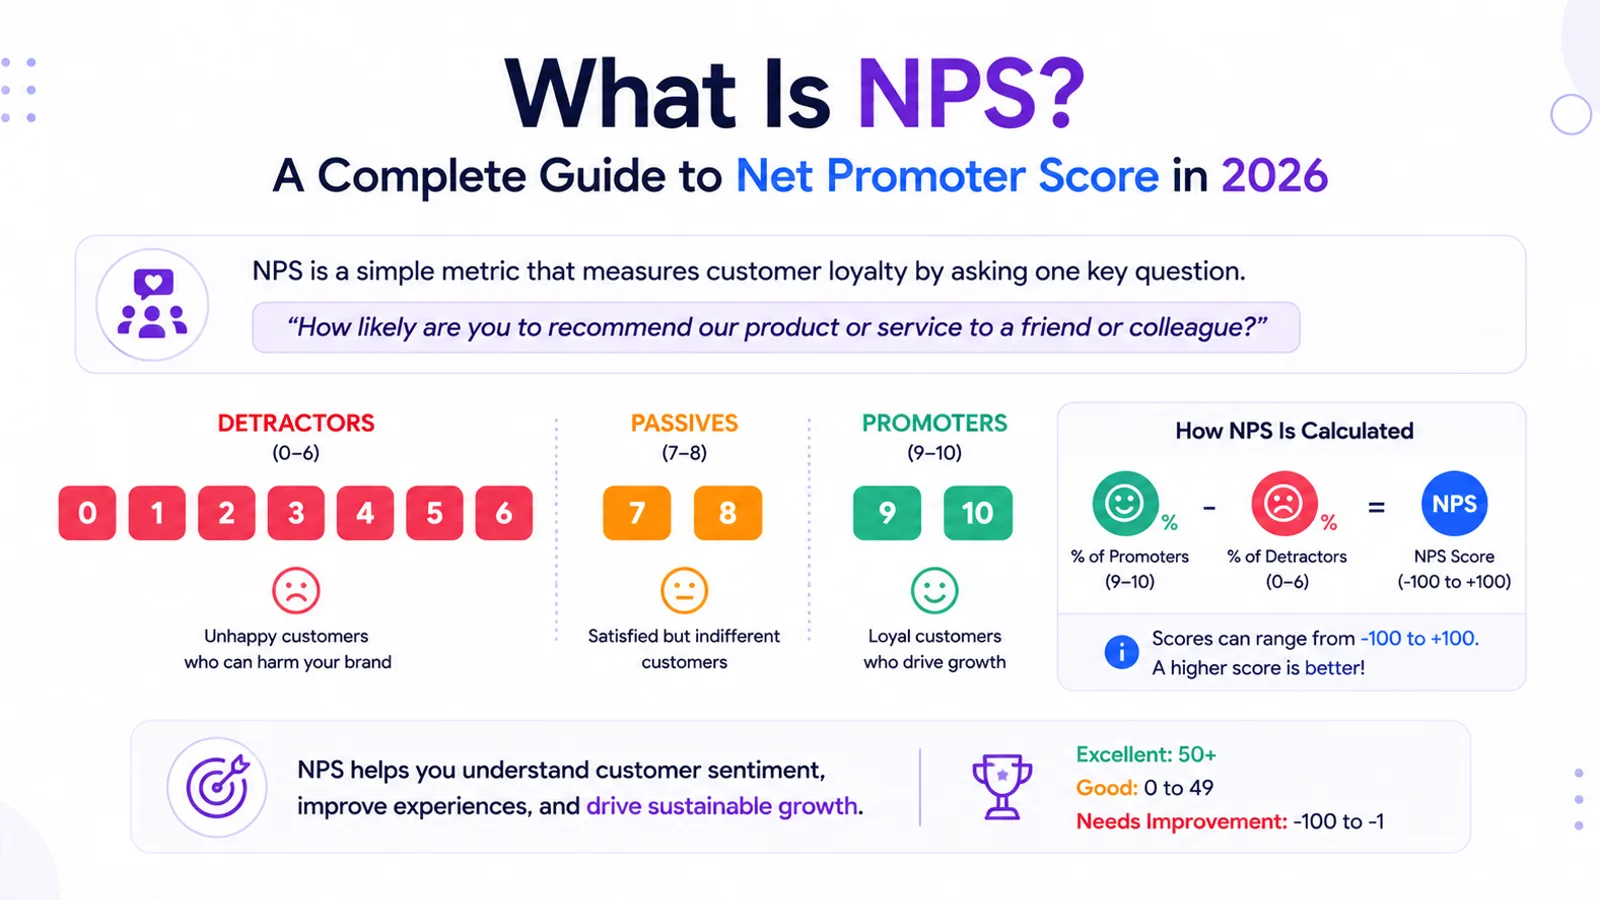
Learn what Net Promoter Score (NPS) is, how NPS surveys work, how organizations measure customer loyalty, and how AI-powered platforms like Sentink modernize NPS analytics and reporting.