
Constant-Sum (Numeric Allocation) Questions: When and How to Use "Split 100 Points"
Learn when to use constant-sum (split 100 points) questions, how to set them up in Sentink with a live running total, and how to read the results.
TL;DR
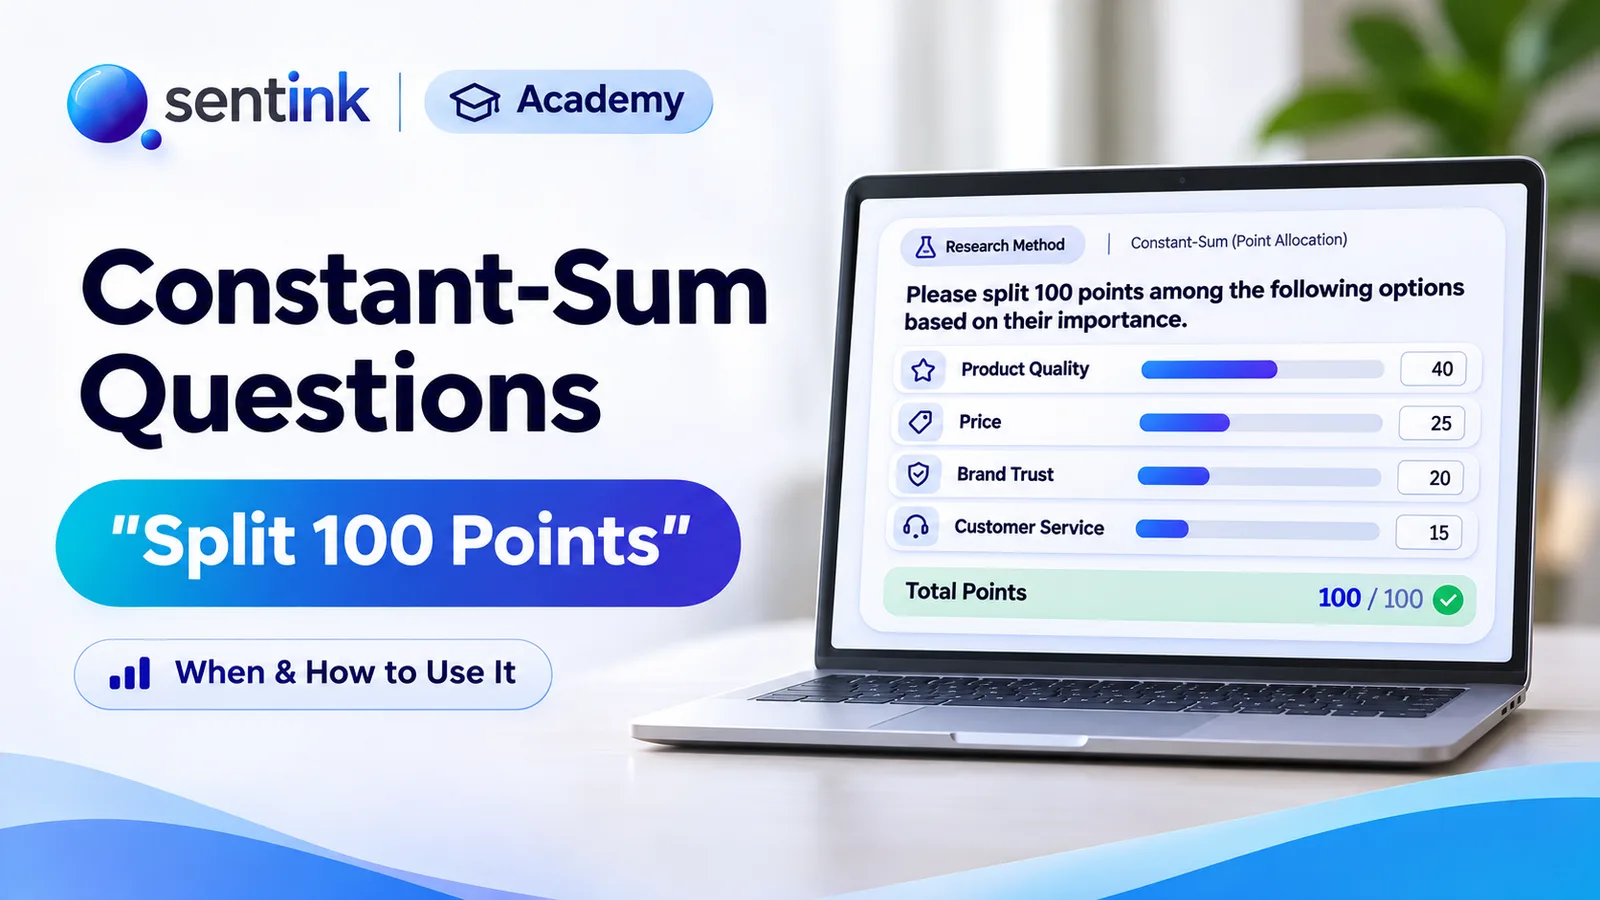
Constant-sum questions give respondents a fixed budget, usually 100 points, to share across items, which forces trade-offs and shows relative importance. In Sentink, the Numeric Allocation question sets a required total, per-item limits, a unit and a live running total, and results show average, median and range per item, also in AI reports and PowerPoint.
Key takeaways
- Constant sum forces trade-offs, so it shows relative importance that rating scales hide.
- It works best for 4–8 items; use MaxDiff for longer lists and Conjoint for product bundles.
- Sentink's Numeric Allocation sets an exact, minimum or maximum total, per-item limits and a unit such as %.
- A live running total shows points left, over or needed, and confirms when the answer is complete.
- Results show average allocation, median, range and how many respondents met the total rule.
- AI reports read the per-item averages, and PowerPoint export includes a bar chart.
Ask people to rate how important five things are, and most of them will say "very important" to almost everything. Rating scales are free: saying one thing matters costs nothing, so the scores bunch together.
Constant-sum questions fix this by giving respondents a fixed budget, usually 100 points, to share across the options. If price gets 50 points, there are only 50 left for everything else. Trade-offs become visible, and you learn what people would actually give up.
In Sentink, this question type is called Numeric Allocation.
What Is a Constant-Sum Question?
A constant-sum (or point allocation) question asks respondents to divide a fixed total across a list of items. For example:
"Imagine you have 100 points. Share them across these features according to how important each one is to you when choosing a phone."
| Feature | Points |
|---|---|
| Battery life | 35 |
| Camera | 25 |
| Price | 30 |
| Screen size | 10 |
| Total | 100 |
The result is a ratio-level measure of relative importance. A feature with 30 points matters roughly three times as much as one with 10, which ordinary rating scales can't tell you.
When to Use Constant Sum
Constant-sum questions work best when you need relative weight, not absolute opinion.
| Use case | Example |
|---|---|
| Feature or attribute importance | "Share 100 points across these product features." |
| Budget and spend share | "What percentage of your monthly grocery spend goes to each store?" |
| Time allocation | "Out of 100% of your screen time, how much goes to each app?" |
| Share of wallet / share of requirements | "Of your last 10 coffee purchases, how many were from each brand?" |
| Channel mix | "What share of your shopping is online, in-store and by phone?" |
| Priority setting for public services | "Distribute 100 points across these community priorities." |
When to choose something else
- Long lists (more than about 8–10 items): the arithmetic gets tiring. Consider MaxDiff, which shows a few items at a time.
- Product bundles and pricing: use Conjoint, which models trade-offs between full product profiles.
- Simple satisfaction: a rating scale is fine when you don't need trade-offs.
Setting Up a Numeric Allocation Question in Sentink
Add Numeric Allocation from the question toolbox. It starts as a typical "split 100%" question, which you can then adjust.
The total rule
- Required total: for example, the answers must add up to exactly 100
- Or set a minimum total and/or maximum total for more flexible questions, such as "up to 24 hours"
- A total label, such as "Total" or "Total %"
Per-item limits
- Minimum and maximum per item, for example 0–100
- Use the same limits for every item, or set different limits for specific items
Unit
Show a unit after the numbers, such as %, points, hours or a currency, so respondents always know what they're allocating.
Running total
Switch on Show a running total and respondents see, as they type:
- how many points are left
- how many they are over
- how many more are needed
- All set when the total is right
This is the single most important setting for data quality. Respondents fix their answers before submitting, instead of being stopped by an error at the end.
Error message
Sentink stops respondents from continuing until the total rule is met. You can write your own error message using placeholders for the current total, the minimum, the maximum and the unit.
Reading the Results
On the Results page, a numeric allocation question shows an Average allocation card with:
- Respondents: how many answered
- Average total: a quick sanity check
- Met the total rule: how many respondents' answers matched your rule
- For each item: average, median and min – max
The averages are what you usually report: "On average, respondents gave battery life 32 points, price 28 and camera 24." The median and range show whether a high average comes from broad agreement or from a few people giving one item everything.
In AI reports and PowerPoint
- AI reports and chat read numeric allocation answers as per-item averages, so AI summaries describe the real priorities
- PowerPoint export shows a bar chart of average allocation, ready for a presentation
Exports
Each item is exported as its own numeric column, ready for further analysis in Excel, SPSS, R or Python, such as comparing segments or running regressions.
Best Practices for Constant-Sum Questions
- Keep the list short. 4–8 items is ideal. With more, respondents start using round numbers just to finish.
- Use 100 as the total. People find percentages intuitive. Use other totals (10 purchases, 24 hours) only when they match real life.
- Always show the running total. It improves completion and data quality more than any other setting.
- Explain the task clearly, with an example if your audience is new to it.
- Allow zero. If an item doesn't matter at all, respondents should be able to give it 0 points.
- Compare segments. The most useful insights often come from how different groups allocate differently.
- Test it on a phone. Make sure the list and running total are comfortable on small screens.
Constant Sum vs Rating Scales vs MaxDiff
| Rating scale | Constant sum | MaxDiff | |
|---|---|---|---|
| Forces trade-offs | No | Yes | Yes |
| Shows relative weight | Weak | Strong (ratio) | Strong (relative) |
| Respondent effort | Low | Medium | Medium |
| Best list length | Any | 4–8 items | 8–30 items |
| Best for | Satisfaction, agreement | Importance, share of spend or time | Prioritising long lists |
Getting Started
- Open your survey in the builder
- Add Numeric Allocation from the toolbox
- Enter your items and set the total rule (for example exactly 100)
- Choose the unit, per-item limits and Show a running total
- Preview on mobile, publish, and open Results to see the average allocation
FAQ
What is a constant-sum question?
A question that asks respondents to divide a fixed total, such as 100 points or 100%, across a list of items according to importance, spend or time.
How many items should a constant-sum question have?
Four to eight items is ideal. For longer lists, MaxDiff is usually easier for respondents.
Can respondents see the total while they answer?
Yes. Turn on Show a running total and respondents see how many points are left, over or still needed, and when they are all set.
Does the total have to be exactly 100?
No. You can require an exact total or set a minimum and/or maximum total, and choose any unit such as %, points or hours.
How are the results shown?
An Average allocation card shows respondents, average total, how many met the total rule, and the average, median and min–max for each item.
Transparent Cloud plans and private deployment—pick what fits your team.
Get Started FreePeople also read
Picked from the same category and shared topics.
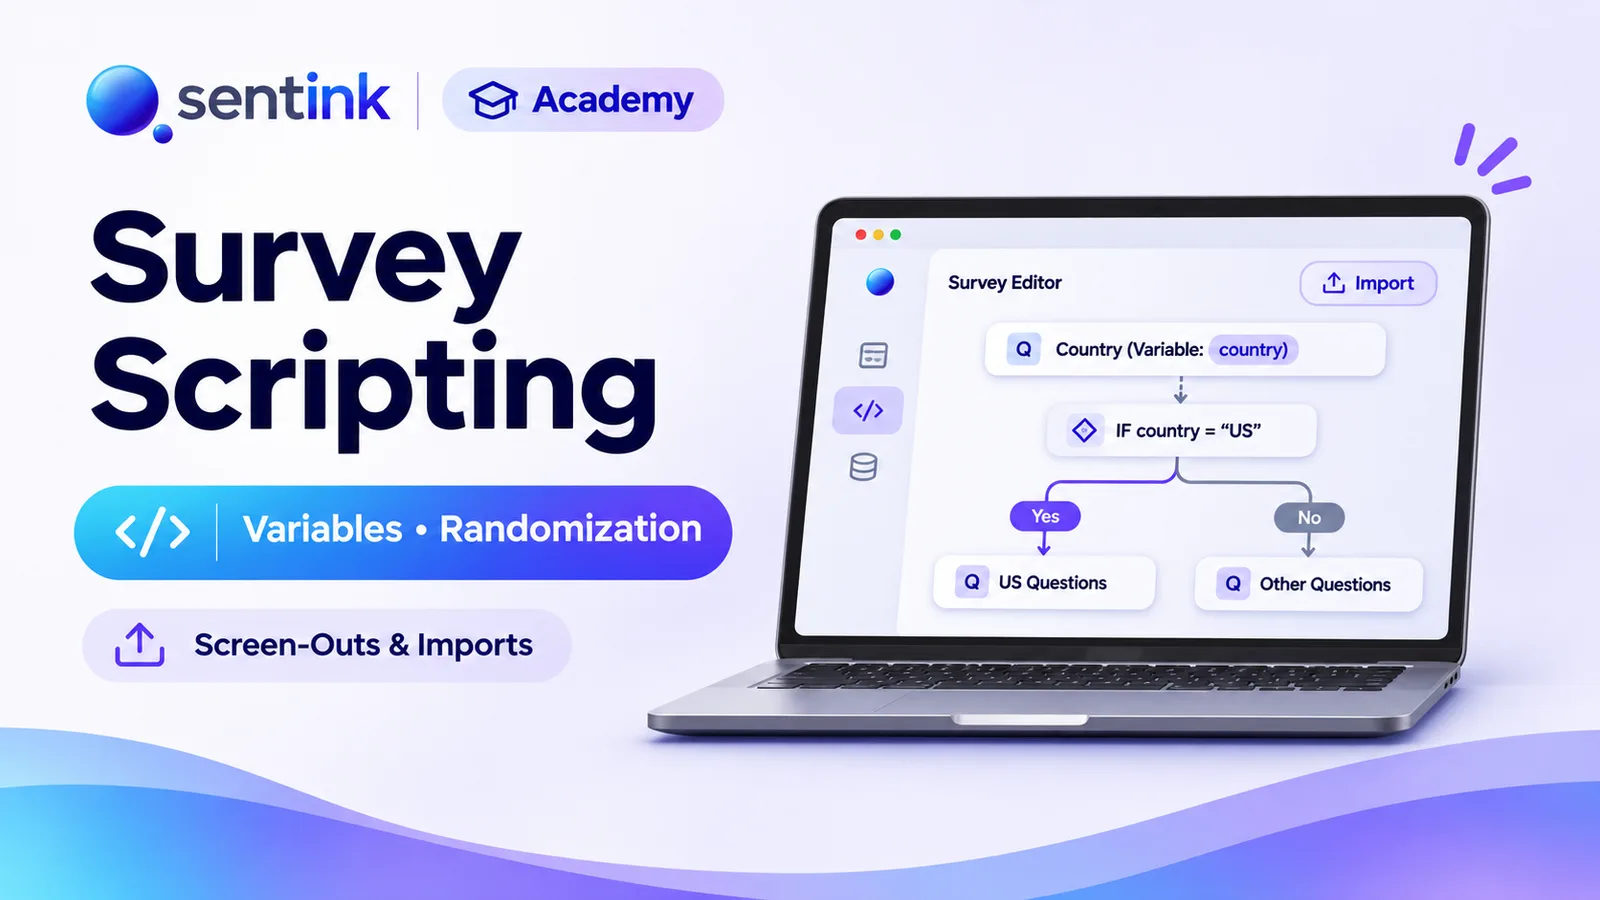
Script professional surveys in Sentink: import Word questionnaires as written, add variables, control randomization, screen out and redirect to panels.

Let respondents click on an image and see every click as a heatmap. Use Sentink image hotspots for packaging, ad, UX and shelf testing.

Learn how to create executive-ready survey reports using AI, automate survey reporting workflows, summarize feedback, visualize insights, and modernize analytics with platforms like Sentink.

Learn how to build effective survey dashboards, visualize survey data, track customer insights, and use AI-powered analytics platforms like Sentink for intelligent reporting and decision-making.
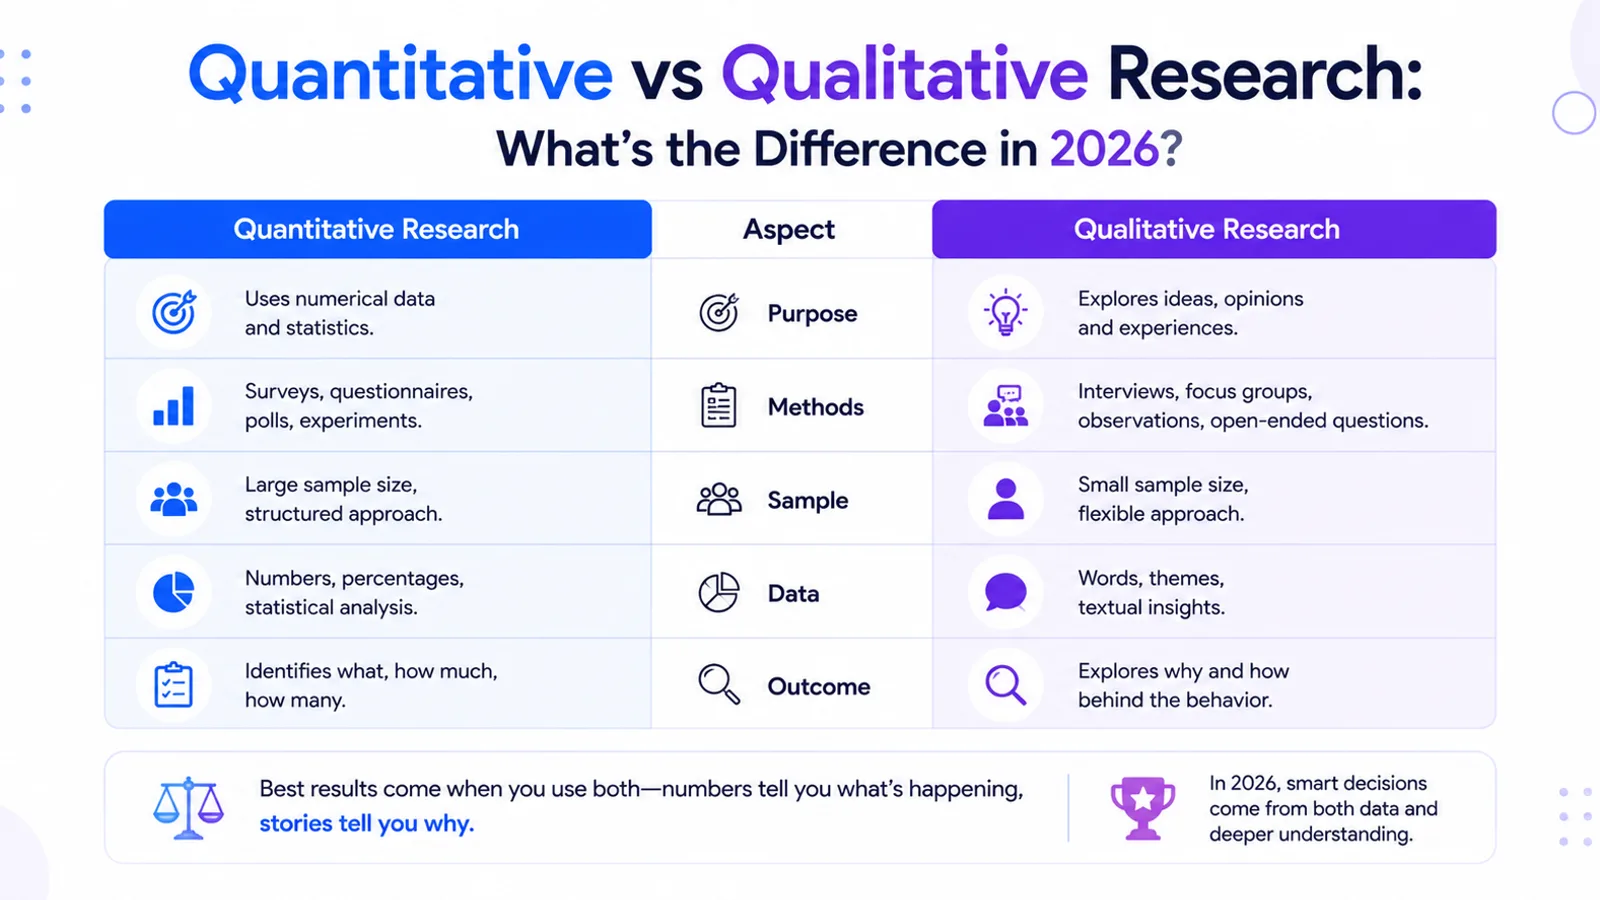
Learn the differences between quantitative and qualitative research, how organizations use both research methods, and how AI-powered platforms like Sentink modernize survey analytics and insights.
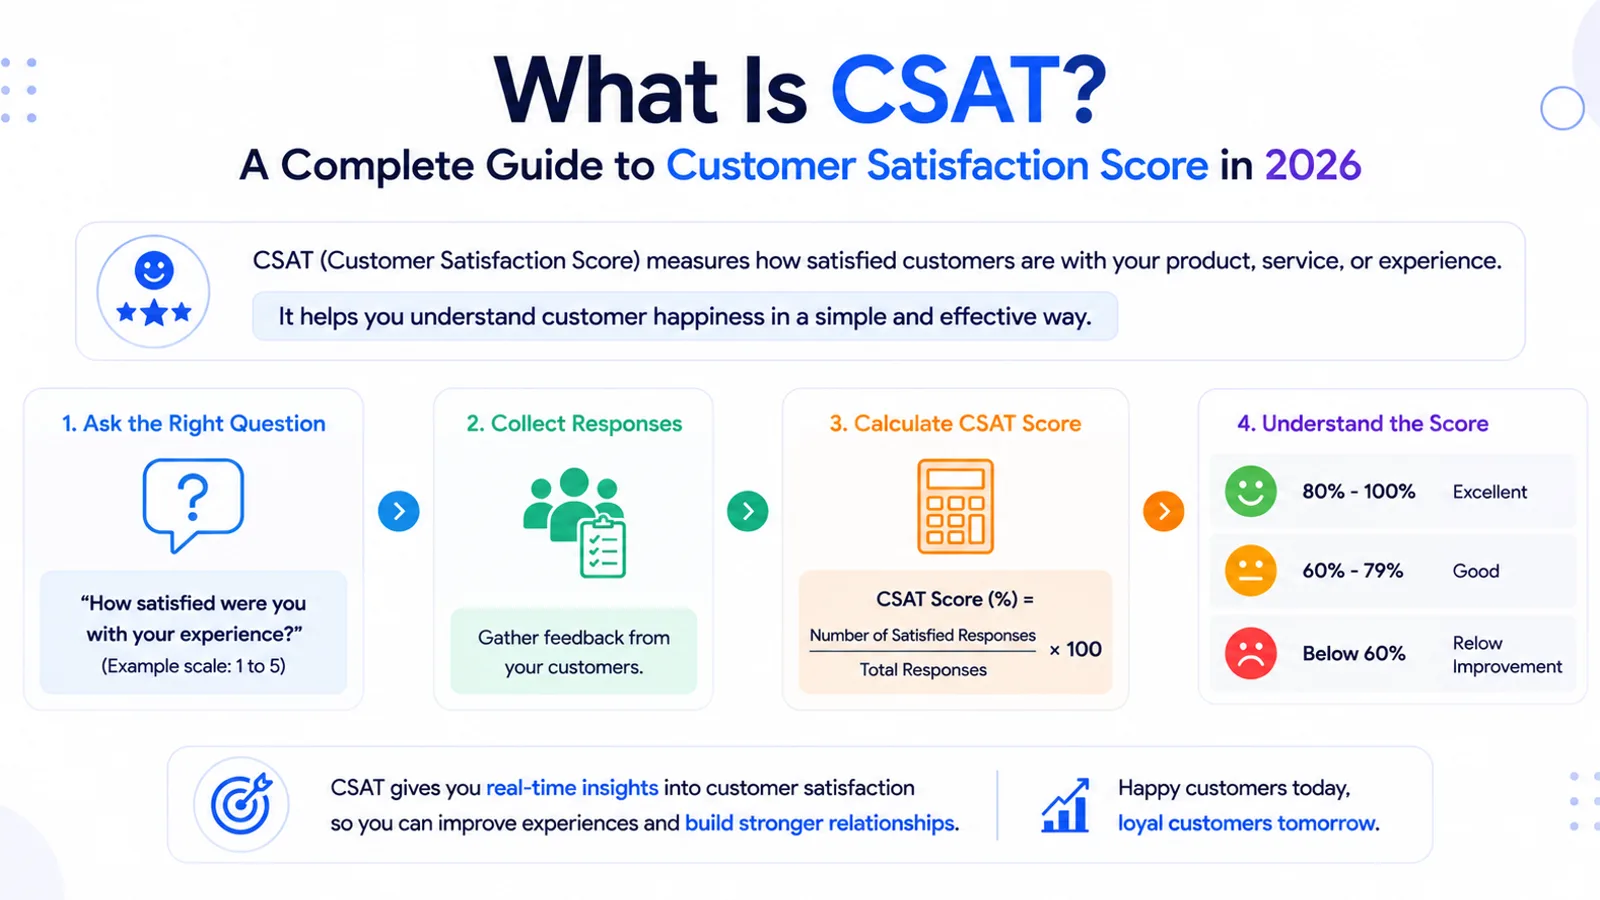
Learn what CSAT (Customer Satisfaction Score) is, how CSAT surveys work, how organizations measure customer satisfaction, and how AI-powered platforms like Sentink modernize customer experience analytics.