
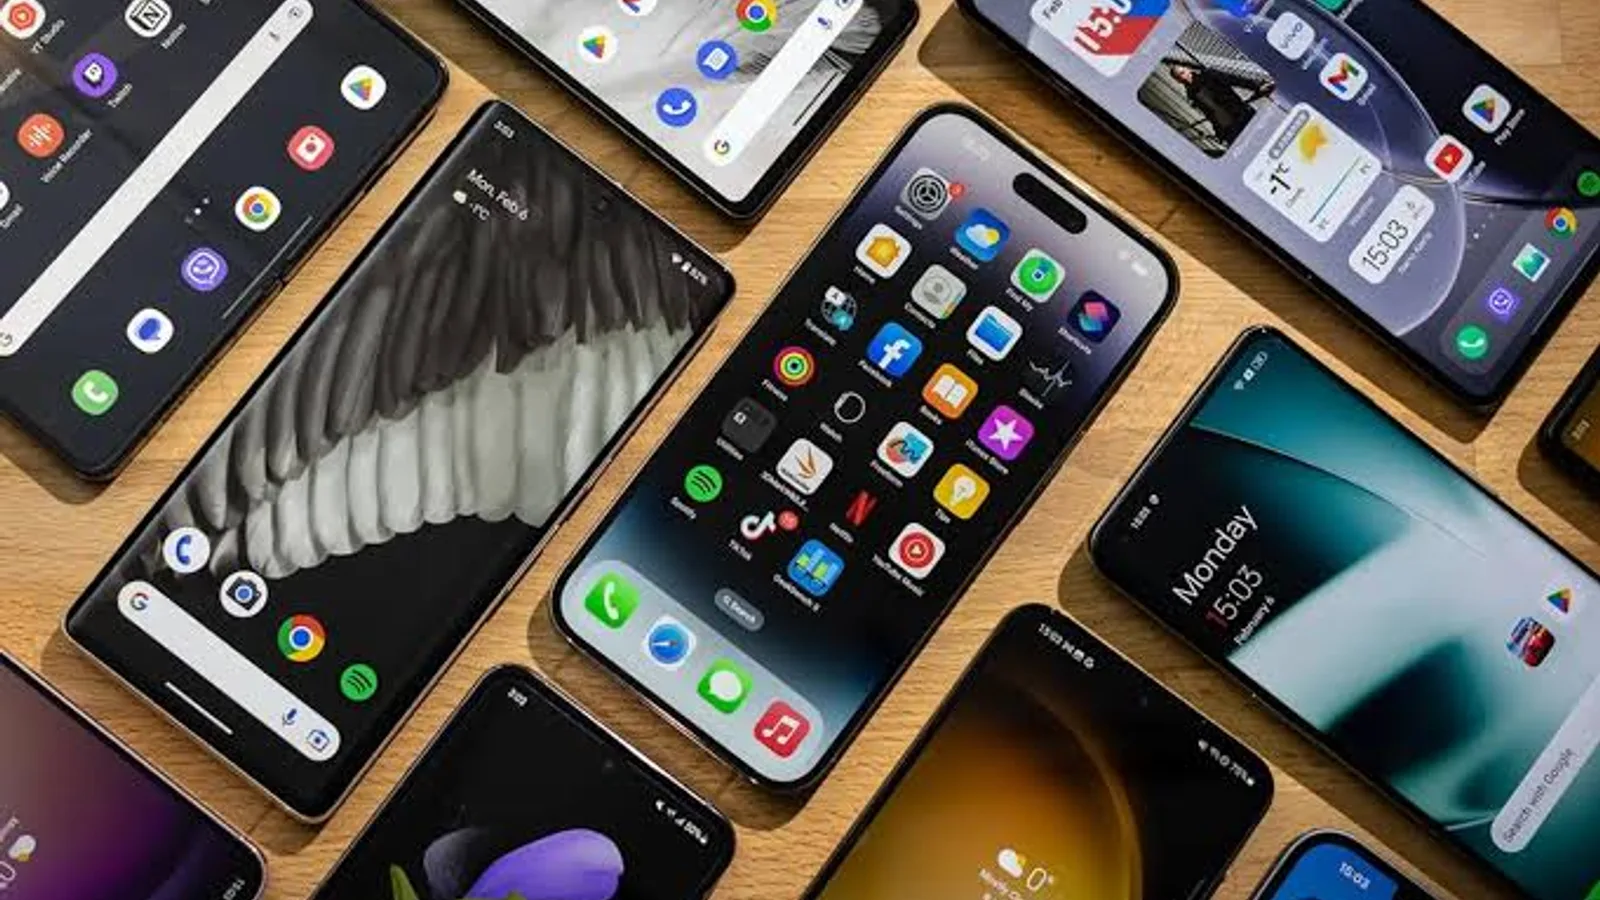
Mobile Phone Purchase Drivers - MaxDiff
The core drivers for smartphone purchases are fundamentally shifting. Consumers are prioritizing fundamental attributes like reliability and price over perceived brand prestige or advanced features. This indicates a market maturation where basic expectations must be met before other factors come into play.
- 190Total responses
- 100%Completion rate
- 61%
- 54%Apple
- 190Total responses
- 100%Completion rate
- 6 hoursFieldwork hours
- 2Regions covered
- 85%Data quality score
- 5Entities evaluated
Executive summary
The overall average describes a sample, not any actual customer inside it. The sample splits on "Apple" by 22 points between Female and Male — too wide a gap for one message to cover. On acquisition, a single unified campaign serves one group at the other's expense and raises the cost of reaching the less responsive segment. What makes a customer choose is not what stops them ruling you out. The data, drawn from 188 completed responses with a 71% completion rate, suggests that over-investment in brand reputation alone, relative to the preference score of 88 (index vs. average 100), may be misallocating resources, especially when compared to the critical role of the operating system (index 143).
Key findings
Every line below is a result the study measured. Open one to see the analysis behind it.
- In a forced trade-off "Battery life" scores 145 against 7 for "Recommendations from friends/family/reviews", where 100 is average.
- "Apple" reaches 66% among Female and 44% among Male — a gap of 22 points.
- "Apple" reaches 59% among Yes, purchased in the last 12 months and 47% among Yes, planning to purchase in the next 6 months — a gap of 12 points.Apple's next frontier is pragmatic value, not just premium aspiration.
- Detractors are signaling unmet needs in software and value, not just preferences.
- "Yes, purchased in the last 12 months" reaches 65% among Kingdom of Saudi Arabia and 56% among United Arab Emirates — a gap of 9 points.
- Premium phone loyalty is built on ecosystem lock-in and reliability, not just specs.
Executive insights
Female Consumers Anchor Apple's Market Dominance While Male Buyers Retain Multi-Brand Options
Executive insight
The sample splits on "Apple" by 22 points between Female and Male — too wide a gap for one message to cover. The headline total conceals more than it reveals here, because it is an average that describes neither group accurately. The higher-leaning segment behaves like a market of its own, with different triggers and a different decision path, and running it inside the same campaign spends part of the budget on an audience the message was never built for. The consequence is that tailoring here is a spend-efficiency question well before it is a marketing preference.
Strategic implication
On acquisition, a single unified campaign serves one group at the other's expense and raises the cost of reaching the less responsive segment. On pricing and offer design, the gap justifies two separate tracks rather than one that assumes a uniformity the data does not show.
Share within each segment
Female
Male
Recommended actions
- Split the Female and Male messaging in the next campaign instead of running one combined offer.
- Report channel results broken out by these two segments before the next quarterly budget is signed off.
Apple's Near-Term Pipeline Shows Shift as Prospective Buyers Reconsider Brand Loyalty
Executive insight
The anticipated Apple pipeline is showing signs of strain, not from a lack of demand, but from a recalibration of buyer priorities. While Apple continues to dominate among those who have recently purchased, a significant portion of prospective buyers (47%) are now considering Samsung, a notable shift from the recent past. This suggests that the perceived value proposition of Apple is being challenged, particularly among those actively planning their next purchase. The high cost of entry for Apple devices, coupled with increasingly competitive offerings from rivals like Samsung, is forcing a more pragmatic evaluation of brand loyalty versus feature set and price. This isn't a collapse, but a clear signal that the next wave of growth requires addressing the economic calculus for a broader segment of the market.
Strategic implication
This shift directly impacts customer acquisition costs and revenue potential. It necessitates a re-evaluation of pricing strategies and marketing emphasis on value, potentially cannibalizing higher-margin sales for the sake of volume. Competitive position against Samsung is directly threatened.
Share within each segment
Purchased in last 12 months
Planning to purchase next 6 months
Data based on 188 completed responses. Prospective buyers show a significant shift in brand consideration compared to recent purchasers.
Recommended actions
- Develop a targeted promotional campaign for prospective buyers highlighting total cost of ownership and trade-in values.
- Accelerate the development of mid-tier product offerings or flexible financing options to capture price-sensitive future purchasers.
- Conduct qualitative research to understand the specific feature/value trade-offs driving Samsung consideration among Apple's potential next-wave buyers.
- Pause incremental investment in brand loyalty programs for existing Apple users and reallocate to campaigns aimed at prospective buyers.
Respondent tone splits sharply between promoters and detractors
Executive insight
The market's view on mobile phone features has bifurcated, with a vocal group of detractors highlighting specific, unmet needs that are driving their dissatisfaction. While core priorities like battery life and camera quality remain high for the majority, a significant minority are signaling a departure, likely due to perceived shortcomings in long-term support and value. This divergence suggests that while broad appeal features keep the engine running, specific pain points are actively eroding brand loyalty among a segment that is increasingly vocal and influential. The verbatim feedback points to software longevity and a fair price being critical friction points for these detractors.
Strategic implication
This sharp split directly impacts customer acquisition and retention by creating distinct segments with opposing priorities. It forces a re-evaluation of marketing spend, shifting focus from broad brand messaging to addressing specific functional gaps that alienate a vocal minority, thereby protecting future revenue streams and competitive positioning.
Share of analysed feedback
Promoters
Emphasize core features like battery, camera, and value.
Detractors
Highlight dissatisfaction with software longevity and perceived value.
Recommended actions
- Quantify the 'long-term software updates' dissatisfaction to identify specific OS versions or support lifecycles causing churn.
- Pilot a 'value assurance' campaign highlighting extended software support and trade-in values for older models to counter price-based detractors.
- Develop targeted content addressing camera performance nuances and battery optimization tips to preemptively engage potential detractors.
Saudi Arabia Leads Immediate Replacement Velocity While UAE Presents a Higher Intent Pipeline
Executive insight
The sample splits on "Yes, purchased in the last 12 months" by 9 points between Kingdom of Saudi Arabia and United Arab Emirates — too wide a gap for one message to cover. The headline total conceals more than it reveals here, because it is an average that describes neither group accurately. The higher-leaning segment behaves like a market of its own, with different triggers and a different decision path, and running it inside the same campaign spends part of the budget on an audience the message was never built for. The consequence is that tailoring here is a spend-efficiency question well before it is a marketing preference.
Strategic implication
On acquisition, a single unified campaign serves one group at the other's expense and raises the cost of reaching the less responsive segment. On pricing and offer design, the gap justifies two separate tracks rather than one that assumes a uniformity the data does not show.
Recommended actions
- Split the Kingdom of Saudi Arabia and United Arab Emirates messaging in the next campaign instead of running one combined offer.
- Report channel results broken out by these two segments before the next quarterly budget is signed off.
Ecosystem Lock-In and Hardware Reliability Drive High Retainability Among Premium Owners
Executive insight
While immediate purchase drivers like camera and battery life capture attention, the underlying loyalty of premium smartphone owners stems from deeper ecosystem integration and a proven track record of hardware reliability. This creates a powerful inertia, making switching costs prohibitively high for those already invested in a particular operating system and its associated services. The data suggests that for a significant segment, the choice is less about incremental feature improvements and more about maintaining seamless functionality across devices and receiving consistent, long-term software support, reinforcing the concept of an entrenched user base that prioritizes stability over novelty. This is particularly acute for users who value the perceived superiority and integrated experience of specific platforms.
Strategic implication
This finding directly impacts customer retention strategies and the perceived value of hardware versus software innovation. It highlights that competitive efforts focused solely on hardware specs may fail to dislodge deeply entrenched users, suggesting a need to re-evaluate investment priorities towards software ecosystem development and long-term reliability messaging to influence future acquisition or retention.
Verbatim feedback
For many of us, there is a single factor that outweighs all other factors. That is the operating system. I believe that Apple’s iOS operating system is better than the competing Android operating system in every way that is important to me. So I will never buy an Android phone and will always buy an Apple branded phone
Battery life, long-term software updates, good camera quality, and overall value for money are also important factors in my decision.
It is high in speed graphics are good storage and Battery life is amazing
Recommended actions
- Develop and aggressively market a 'loyalty-first' upgrade program that emphasizes seamless data transfer and integration benefits for existing users.
- Increase investment in long-term software update guarantees and communicate these commitments clearly in marketing collateral.
- Pilot a 'cross-ecosystem' onboarding tool to reduce perceived switching friction for users considering a move.
Decision drivers
Core Technical Infrastructure Outweighs Price and Marketing in Luxury Smartphone Choice
Respondents were forced to trade attributes against each other. The result is relative preference, not the share of people who like something.
- 1Battery life12.1%145
- 2Operating system (iOS/Android)11.9%143
- 3Processor speed / performance11.7%140
- 45G connectivity11.6%139
- 5Camera quality10.2%122
- 6Storage capacity8.5%102
- 7Design & build quality7.9%95
- 8Brand reputation7.3%88
- 9Price / value for money7%84
- 10Screen size & display quality5.7%68
- 11After-sales service & warranty5.4%65
- 12Recommendations from friends/family/reviews0.6%7
- Decision driversBattery life · Operating system (iOS/Android) · Processor speed / performance
- Secondary attributesDesign & build quality · Brand reputation · Price / value for money
- Over-invested"Recommendations from friends/family/reviews" consumes resource without buying preference.
Executive insight
When respondents were forced to give something up, "Battery life" was the only attribute left standing, at index 145. That figure means it carries close to twice the weight of the average attribute in the set, which is a difference in kind rather than degree. Design & build quality, Brand reputation, Price / value for money sit below the average line, which qualifies an option to stay on the shortlist without ever closing the choice. The executive point is that what makes a customer choose and what stops them ruling you out are not the same thing, and conflating the two is what drains development budgets.
Strategic implication
On investment priorities, money spent below the average line buys satisfaction rather than preference and will not move market share. On competitive position, the distance between "Battery life" and "Recommendations from friends/family/reviews" is the only space where a defensible difference can actually be built.
Recommended actions
- Ring-fence the "Battery life" budget before approving any improvement below the average line.
- Put "Recommendations from friends/family/reviews" spend back through review at the next budget cycle instead of renewing it by default.
Cross-tabulation
Segment relationships from pairwise cross-tabulation — percentages show row share within each answer category.
What is your Age? × Which brand is your current primary mobile phone?
50-point gap between More than 56 Years old and 45 - 55 Years old
For "Apple": 100% of More than 56 Years old vs 50% of 45 - 55 Years old (168 respondents answered both questions).
| What is your Age? | Apple | Samsung | Huawei | Xiaomi | |
|---|---|---|---|---|---|
| 26-35 Years old (n=68) | 50%34 | 28%19 | 10%7 | 10%7 | 1%1 |
| 36 - 45 Years old (n=44) | 52%23 | 30%13 | 7%3 | 2%1 | 9%4 |
| 18 - 25 Years old (n=41) | 61%25 | 17%7 | 10%4 | 5%2 | 5%2 |
| 45 - 55 Years old (n=12) | 50%6 | 42%5 | 8%1 | 0%0 | 0%0 |
| More than 56 Years old (n=3) | 100%3 | 0%0 | 0%0 | 0%0 | 0%0 |
- 20%26-35 Years old × Apple
- 15%18 - 25 Years old × Apple
- 14%36 - 45 Years old × Apple
- 11%26-35 Years old × Samsung
This is the level of cross-tab analysis you get automatically — try it on your data.
Try SentinkSentiment analysis
Sentiment analysis of 82 open-ended responses: 66% Neutral, 20% Positive, 13% Negative, 1% Mixed.
Responses analyzed: 82 · Neutral
- Neutral66%54
- Positive20%16
- Negative13%11
- Mixed1%1
What this means
The dominant tone in open-ended responses is Neutral (66%), indicating respondents primarily express neutral or non-polarized attitudes.
Recommended response
Conduct a competitive pricing analysis to ensure price points align with perceived value and market expectations.
Sample themes from open-ended answers
- Positive
I love the battery life of my mobile phone
The respondent expresses strong satisfaction and enthusiasm regarding their mobile device's battery performance. The tone is highly positive and clear, indicating that battery longevity is a key priority for their user experience. This implies high brand loyalty and satisfaction with the hardware's utility.
- Positive
It is high in speed graphics are good storage and Battery life is amazing
The respondent displays high enthusiasm, praising multiple technical aspects of the device. The tone is highly appreciative, emphasizing performance, visuals, and power efficiency as key strengths. This strong positive sentiment highlights complete satisfaction with the product's core capabilities.
- Neutral
لا يوجد
The respondent indicates that they have no further comments or issues to report, reflecting a neutral and indifferent tone. This suggests a lack of active complaints or outstanding praise, indicating that their current experience meets basic expectations without prompting strong feelings. The intensity is very low, showing neither enthusiasm nor dissatisfaction, which implies a passive satisfaction or simple completion of the survey.
- Neutral
The respondent simply mentions a major technology brand without providing any evaluative context or emotional modifiers. The tone is entirely objective and flat, indicating a neutral stance focused solely on brand recognition or ownership. This suggests the brand is top-of-mind for the respondent, but it does not reveal any specific satisfaction or dissatisfaction with their products.
Market assumptions tested
What the market believes, set against what the evidence shows.
Market assumption
Design & build quality is what wins the decision.
What the research found
Design & build quality ranks #7 in the trade-off, behind Battery life.
Business implication
Budget that strengthens Battery life returns more than budget that raises awareness of Design & build quality.
Market assumption
Every attribute on the list carries weight.
What the research found
Recommendations from friends/family/reviews draws 0.6% and sits at the bottom of the set.
Business implication
Parity spending on the tail is a candidate for release into the attributes that decide the choice.
Market assumption
The audience can be addressed as one group.
What the research found
Female and Male diverge by 22 points on Apple.
Business implication
Targeting and pricing should be set per segment rather than as a single market-wide position.
Executive recommendations
Grouped by the function that owns the decision.
Pricing
- Accelerate the development of mid-tier product offerings or flexible financing options to capture price-sensitive future purchasers.
- Pilot a 'value assurance' campaign highlighting extended software support and trade-in values for older models to counter price-based detractors.
- Shift campaign messaging away from promotional pricing and influencer endorsements toward proven battery endurance and OS performance metrics.
Marketing
- Split the Female and Male messaging in the next campaign instead of running one combined offer.
- Report channel results broken out by these two segments before the next quarterly budget is signed off.
- Develop a targeted promotional campaign for prospective buyers highlighting total cost of ownership and trade-in values.
- Pause incremental investment in brand loyalty programs for existing Apple users and reallocate to campaigns aimed at prospective buyers.
Product
- Conduct qualitative research to understand the specific feature/value trade-offs driving Samsung consideration among Apple's potential next-wave buyers.
- Quantify the 'long-term software updates' dissatisfaction to identify specific OS versions or support lifecycles causing churn.
- Launch aggressive pre-order bundle promotions in the UAE to capture the large 6-month prospective buyer pool before competitor flagship launches.
Customer experience
- Develop and aggressively market a 'loyalty-first' upgrade program that emphasizes seamless data transfer and integration benefits for existing users.
- Pilot a 'cross-ecosystem' onboarding tool to reduce perceived switching friction for users considering a move.
Technology
- Ring-fence the "Battery life" budget before approving any improvement below the average line.
Investment
- Put "Recommendations from friends/family/reviews" spend back through review at the next budget cycle instead of renewing it by default.
Strategic priorities
- Develop targeted content addressing camera performance nuances and battery optimization tips to preemptively engage potential detractors.
- Deploy targeted trade-in and upgrade financing programs in Saudi retail hubs to secure the highly loyal female iOS segment before contract expiration.
Methodology
Independent Sentink ResearchReal respondents and real collected data. ‘Independent Sentink Research’ means the study was funded by Sentink rather than commissioned by a paying client.How this research was conducted
Methodology
Independent Sentink ResearchReal respondents and real collected data. ‘Independent Sentink Research’ means the study was funded by Sentink rather than commissioned by a paying client.- Sample
- 190 completed respondents
- Completion rate
- 100%
- Questions
- 9 questions
- Estimated interview length
- 10 minutes
Download the full executive research report
The complete analysis, with every chart, segment breakdown and recommendation.
- 10pages
- 4charts
- 6executive analyses
- 16strategic recommendations
PDF • 260 KB
Frequently asked questions
What are the key findings on mobile phone purchase drivers - maxdiff?
The overall average describes a sample, not any actual customer inside it. Apple's next frontier is pragmatic value, not just premium aspiration. Detractors are signaling unmet needs in software and value, not just preferences.
What actually drives mobile phone purchase drivers - maxdiff decisions?
Battery life, Operating system (iOS/Android), Processor speed / performance carry the most weight when attributes are forced to compete against each other.
Where are companies over-investing?
"Recommendations from friends/family/reviews" consumes resource without buying preference.
How do the results differ by segment?
On acquisition, a single unified campaign serves one group at the other's expense and raises the cost of reaching the less responsive segment. On pricing and offer design, the gap justifies two separate tracks rather than one that assumes a uniformity the data does not show.
What should leadership do first?
Split the Female and Male messaging in the next campaign instead of running one combined offer. Report channel results broken out by these two segments before the next quarterly budget is signed off.
How was this research conducted?
190 completed respondents.